Load packages
# numerical calculation & data frames import numpy as npimport pandas as pd# visualization import matplotlib.pyplot as pltimport seaborn as snsimport seaborn.objects as so# statistics import statsmodels.api as sm# pandas options 'mode.copy_on_write' , True ) # pandas 2.0 = ' {:.2f} ' .format # pd.reset_option('display.float_format') = 7 # max number of rows to display # NumPy options = 2 , suppress= True ) # suppress scientific notation # For high resolution display import matplotlib_inline"retina" )
Why are low quality diamonds more expensive?
Load the dataset
= sm.datasets.get_rdataset("diamonds" , "ggplot2" ).data# cut, color, clarity 모두 categorical type으로 변형 "cut" ] = pd.Categorical("cut" ], = ["Fair" , "Good" , "Very Good" , "Premium" , "Ideal" ],= True "color" ] = pd.Categorical("color" ], = ["D" , "E" , "F" , "G" , "H" , "I" , "J" ],= True "clarity" ] = pd.Categorical("clarity" ], = ["I1" , "SI2" , "SI1" , "VS2" , "VS1" , "VVS2" , "VVS1" , "IF" ],= True
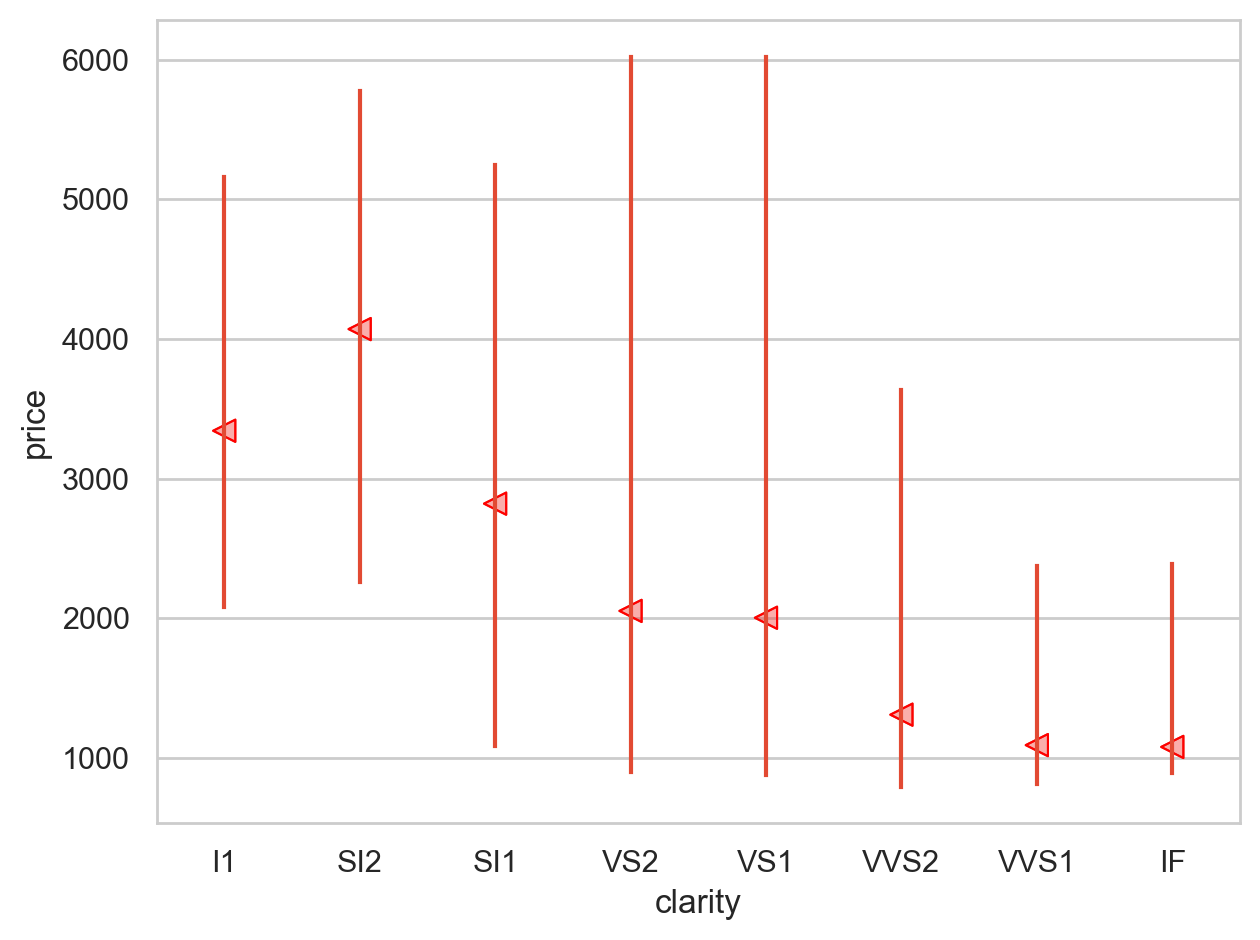
from sbcustom import rangeplot= rangeplot(diamonds, x= "cut" , y= "price" )= rangeplot(diamonds, x= "color" , y= "price" )= rangeplot(diamonds, x= "clarity" , y= "price" )
Price and carat
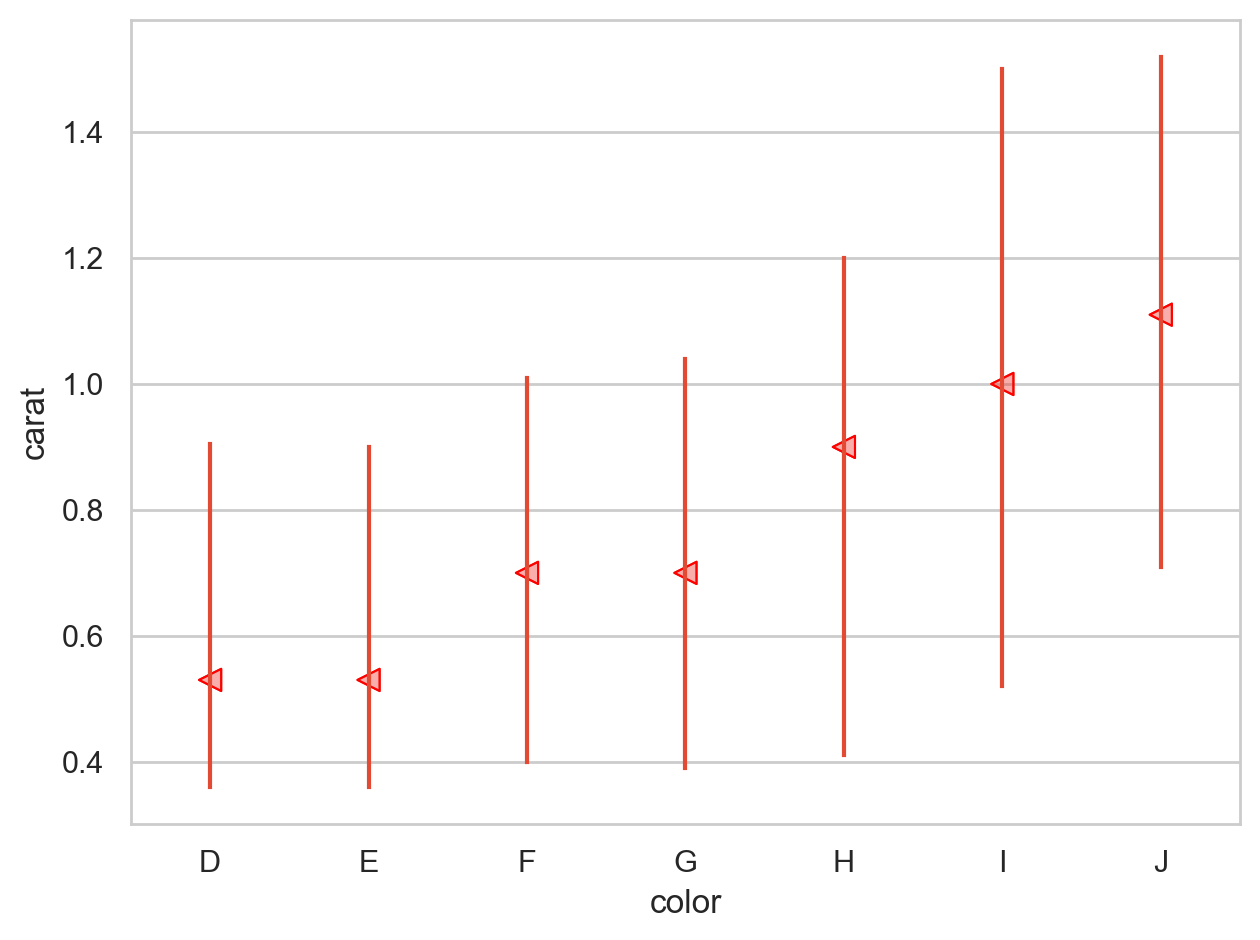
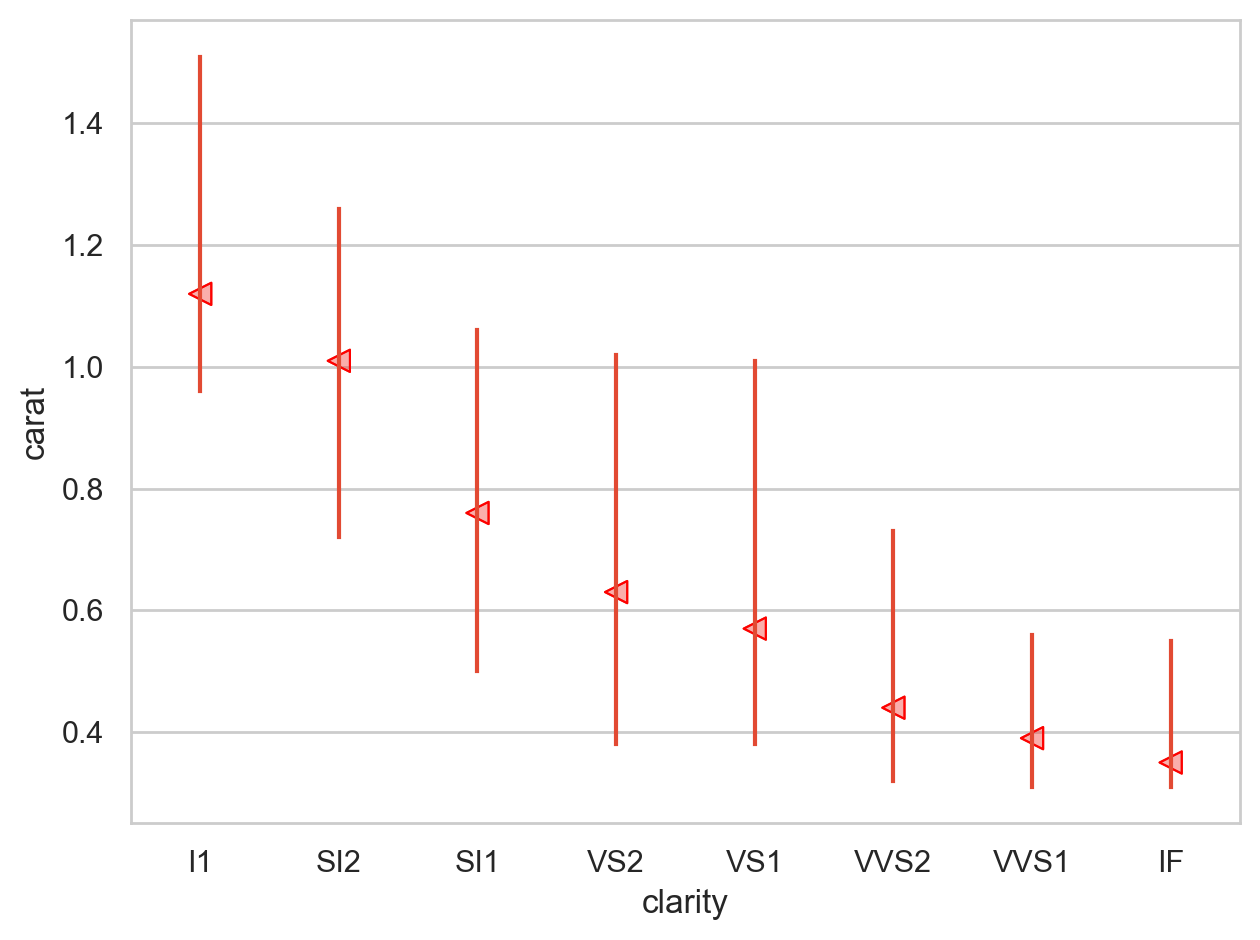
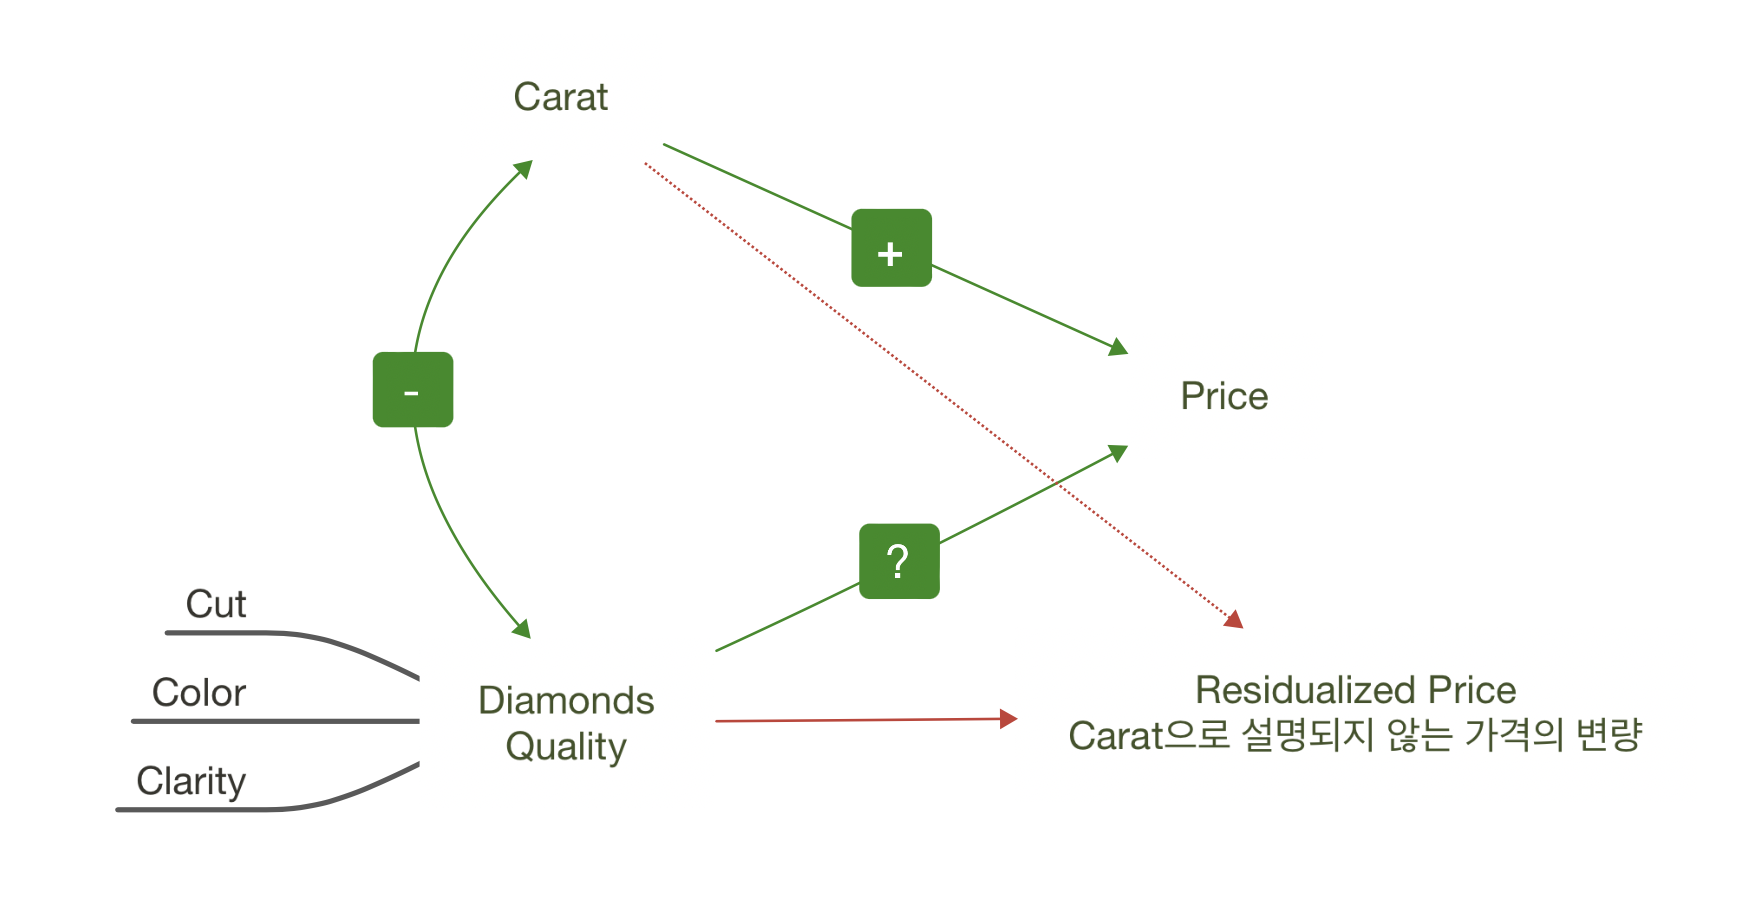
다이아몬드의 퀄리티(cut, color, clarity)가 좋을수록 가벼워짐
= (= 'carat' , y= 'price' )= .1 , color= ".6" ))= rangeplot(diamonds, x= "cut" , y= "carat" )= rangeplot(diamonds, x= "color" , y= "carat" )= rangeplot(diamonds, x= "clarity" , y= "carat" )
우선, 2.5캐럿 이하로 제한하고,
가격과 캐럿을 log-transform하여 선형모형을 세움
이 모형으로 잔차를 구하고,
다이아몬드의 퀄리티와 이 잔차와의 관계를 살펴봄
= diamonds.query("carat < 2.5" ).assign(= lambda x: np.log2(x.price), = lambda x: np.log2(x.carat)
= (= "lcarat" , y= "lprice" )= ".6" , alpha= 0.1 ))5 ))= (= "carat" , y= "price" )= ".6" , alpha= 0.1 ))5 ))
# 캐럿으로 가격을 예측하는 선형모형 import statsmodels.formula.api as smf= smf.ols("lprice ~ lcarat" , data= diamonds2).fit()
# Parmeters
Intercept   12.19
lcarat       1.68
dtype: float64
Model: \(\displaystyle lprice = 1.68 \cdot lcarat + 12.19 + e\)
또는 \(\displaystyle \widehat{lprice} = 1.68 \cdot lcarat + 12.19\)
Prediction
# Data range from the carat variable = pd.DataFrame({"carat" : []})"carat" ]= np.linspace(diamonds2.carat.min (), diamonds2.carat.max (), 20 )= grid.assign(= lambda x: np.log2(x.carat), # 모형의 변수와 동일하게 log 변환 = lambda x: mod_diamonds.predict(x.lcarat), # prediction = lambda x: 2 ** x.lprice # 원래 단위로 되돌리기
    carat  lcarat  lprice    price
0    0.20   -2.32    8.29   312.79
1    0.32   -1.64    9.43   691.47
2    0.44   -1.18   10.21  1182.86
..    ...     ...     ...      ...
17   2.25    1.17   14.16 18318.33
18   2.37    1.24   14.29 19999.52
19   2.49    1.32   14.41 21740.08

[20 rows x 4 columns]
= "carat" , y= "price" )= ".6" , alpha= 0.1 ), x= diamonds2.carat, y= diamonds2.price)
캐럿과 가격은 비선형적인 관계에 있으며, 이를 log-transform하여 선형적인 관계로 만들어줌
또한, variability는 캐럿이 증가함에 따라 비례해서 커지는 양상을 보임; 이 또한 log-transform을 통해 해결되었음
Residuals 분석
위 모형은 충분히 좋은가?
"lresid" ] = mod_diamonds.resid= 'lcarat' , y= 'lresid' )= .1 ))
이제, 다이아몬드의 퀄리티와 위에서 구한 가격의 residuals과의 관계를 살펴보면,
y축은 log2 scale로 변환된 것이므로, 원래 단위로 이해하면,
residual +1은 캐럿으로 예측되는 가격(residual = 0)보다 가격이 2배 비싸다는 것을 의미
residual -1은 캐럿으로 예측되는 가격(residual = 0)보다 가격이 1/2배 낮다는 것을 의미
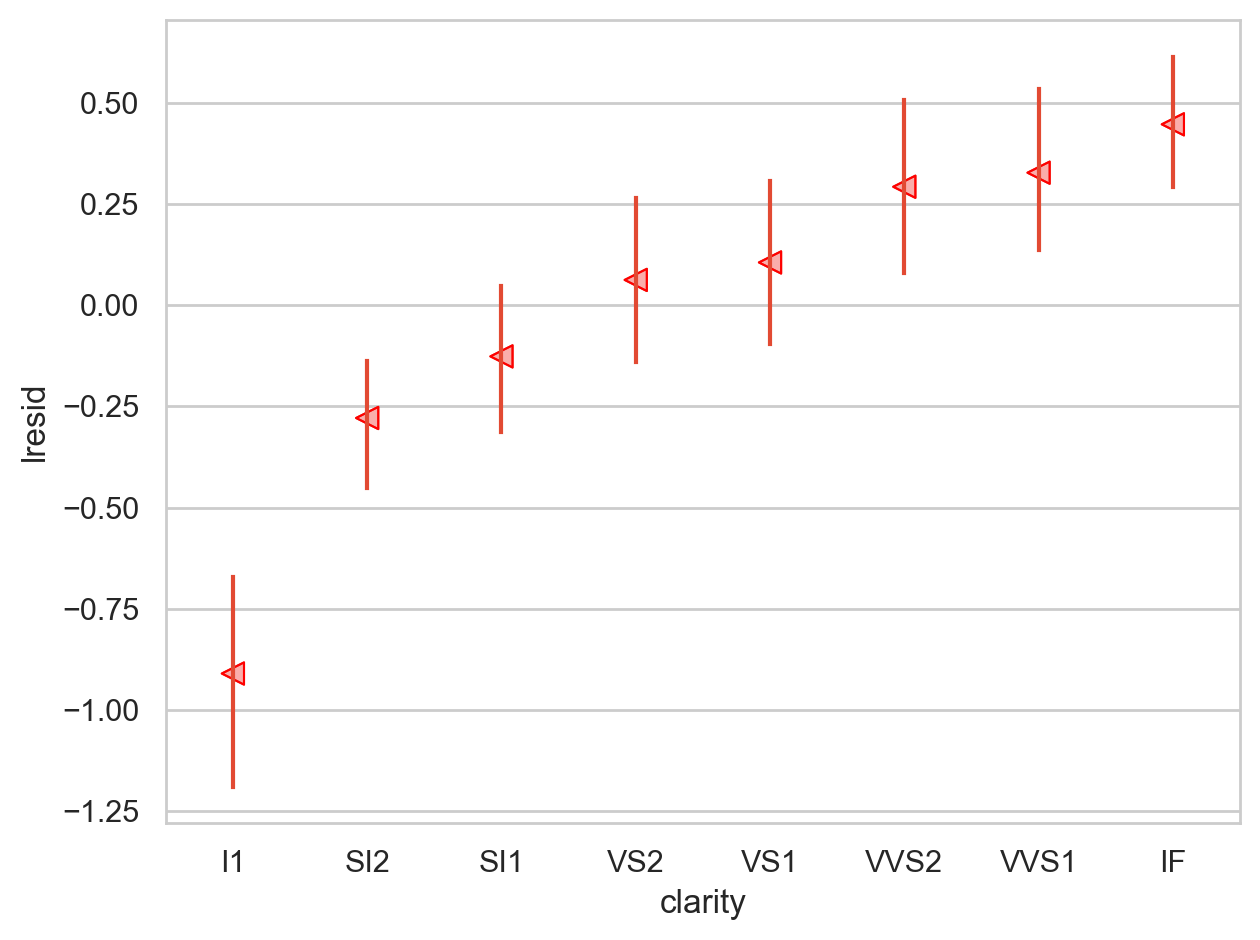
이는 캐럿의 영향을 고려한 후에 , 다이아몬드의 퀄리티 각각이 가격에 (상대적으로) 얼마나 영향을 주는지를 가늠할 수 있음
= rangeplot(diamonds2, x= "cut" , y= "lresid" )= rangeplot(diamonds2, x= "color" , y= "lresid" )= rangeplot(diamonds2, x= "clarity" , y= "lresid" )
= smf.ols("lprice ~ lcarat + cut" , data= diamonds2).fit()= smf.ols("lprice ~ lcarat + color" , data= diamonds2).fit()= smf.ols("lprice ~ lcarat + clarity" , data= diamonds2).fit()# mod.params
Intercept          11.84
cut[T.Good]         0.23
cut[T.Very Good]    0.34
cut[T.Premium]      0.33
cut[T.Ideal]        0.45
lcarat              1.70
dtype: float64
Intercept    12.37
color[T.E]   -0.04
color[T.F]   -0.05
color[T.G]   -0.08
color[T.H]   -0.27
color[T.I]   -0.41
color[T.J]   -0.61
lcarat        1.73
dtype: float64
Intercept         11.24
clarity[T.SI2]     0.66
clarity[T.SI1]     0.87
clarity[T.VS2]     1.08
clarity[T.VS1]     1.15
clarity[T.VVS2]    1.38
clarity[T.VVS1]    1.45
clarity[T.IF]      1.58
lcarat             1.81
dtype: float64
다이아몬드의 3가지 퀄리티가 서로 연관되어 있다면?
A more complicated model
다이아몬드의 3가지 퀄리티와 carat이 모두 연관되어 있어, 각각의 고유한 효과를 보기 위해 다음과 같이 모든 예측변수들을 포함하는 모형을 세울 수 있음
= smf.ols('lprice ~ lcarat + cut + color + clarity' , data= diamonds2).fit()
Prediction
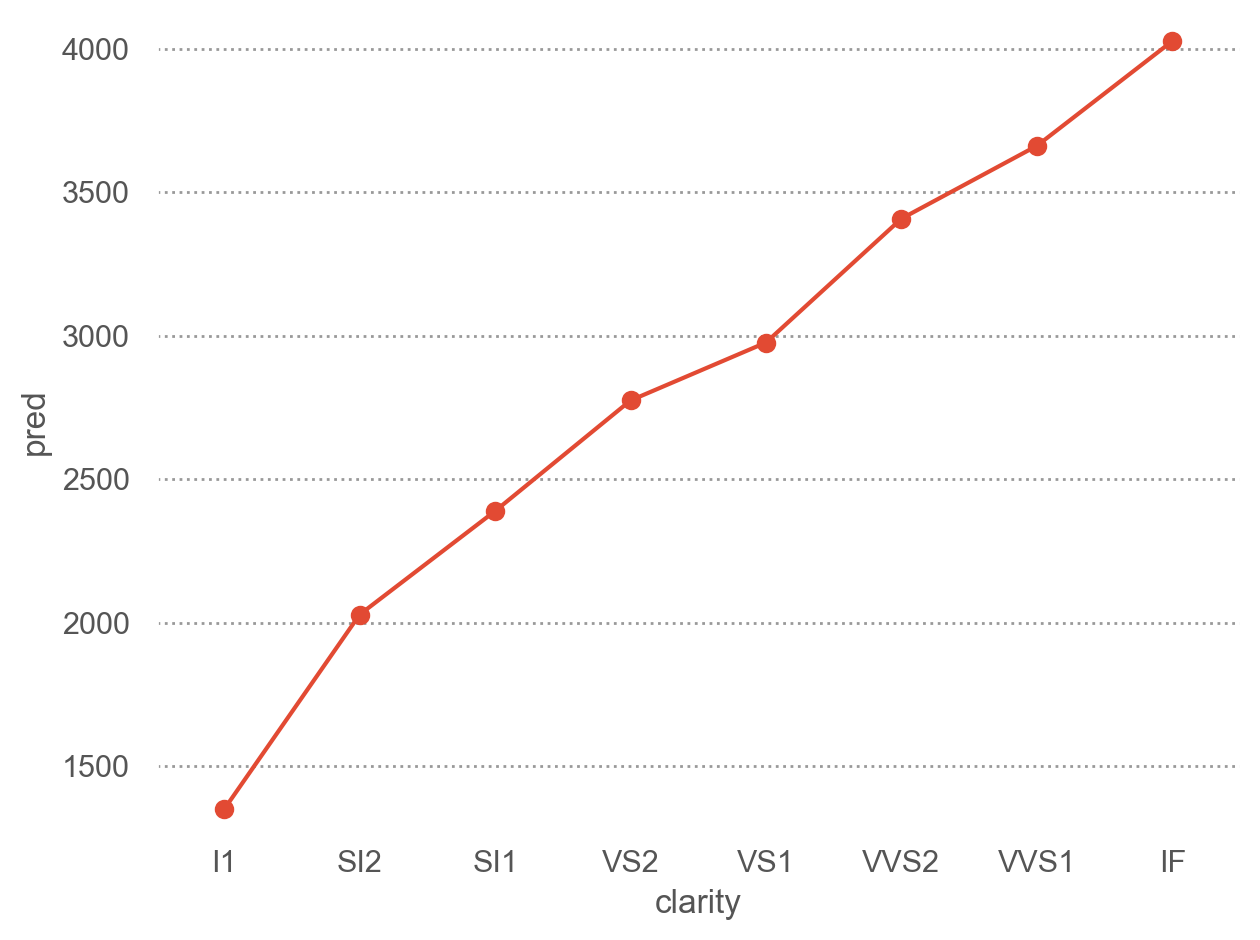
첫번째로 이 모형에 의한, cut에 따른 예측값을 구하기 위해, cut을 제외한 다른 값들을 고정한 grid를 구해보면,
연속변수에 대해서는 보통 평균(mean)이나 중앙값(median)을
카테고리 변수에 대해서는 보통 최빈값(mode)을 사용
= pd.DataFrame({"cut" : ["Fair" , "Good" , "Very Good" , "Premium" , "Ideal" ]})"color" ] = diamonds2.color.mode()[0 ] # mode: 최빈값 "clarity" ] = diamonds2.clarity.mode()[0 ]"lcarat" ] = diamonds2.lcarat.median()
         cut color clarity  lcarat
0       Fair     G     SI1   -0.51
1       Good     G     SI1   -0.51
2  Very Good     G     SI1   -0.51
3    Premium     G     SI1   -0.51
4      Ideal     G     SI1   -0.51
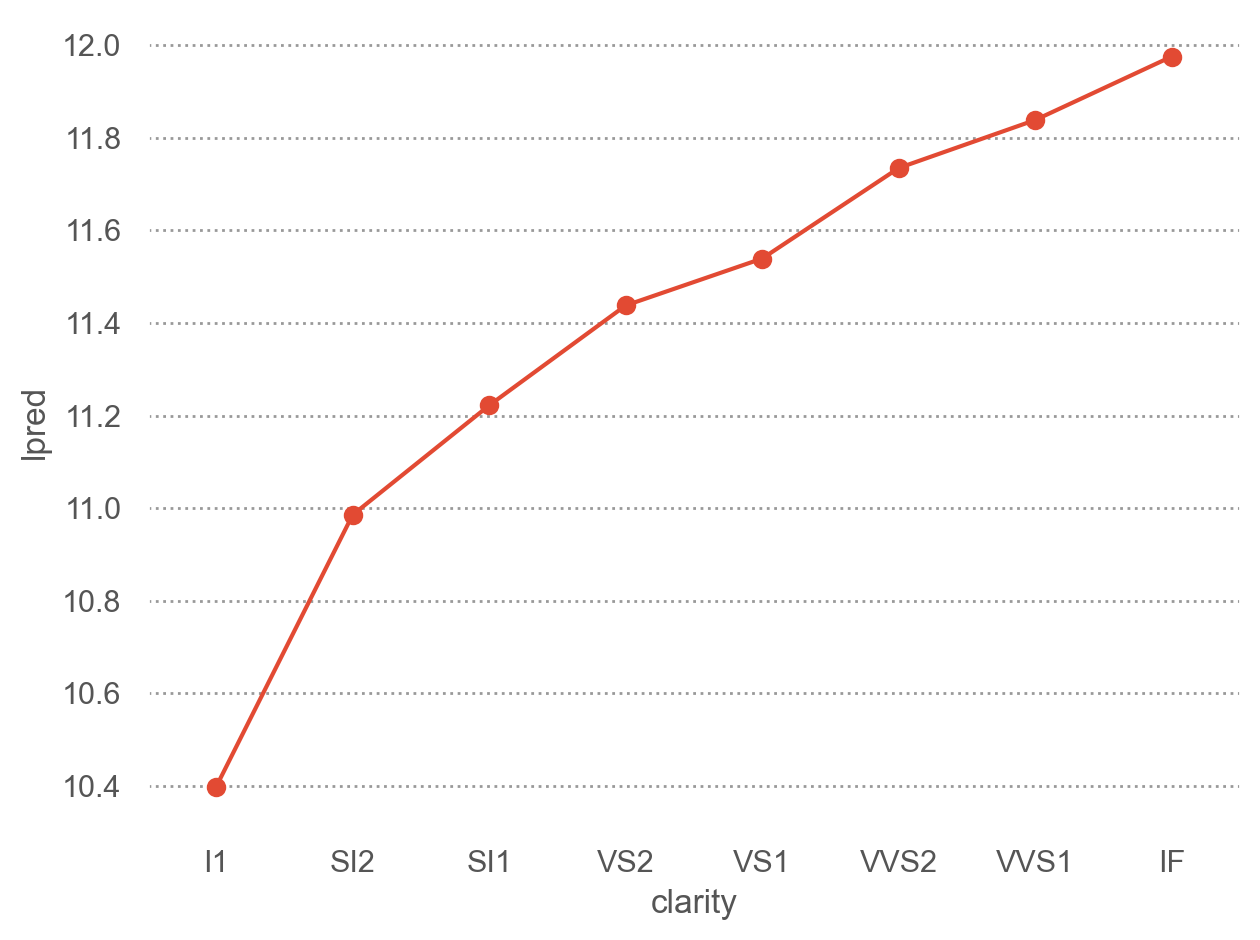
즉, G 컬러이고, SI1의 투명도와, 캐럿(로그) -0.51인 다이아몬드에 대해서, cut이 좋아질수록 가격이 얼마나 올라가는지를 예측해 본다면,
"lpred" ] = mod_full.predict(grid)"pred" ] = 2 ** grid.lpred # 원래 단위인 price로 되돌리기
         cut color clarity  lcarat  lpred    pred
0       Fair     G     SI1   -0.51  10.99 2035.36
1       Good     G     SI1   -0.51  11.10 2202.21
2  Very Good     G     SI1   -0.51  11.16 2285.37
3    Premium     G     SI1   -0.51  11.19 2337.24
4      Ideal     G     SI1   -0.51  11.22 2388.52
= 'cut' , y= 'pred' )= "o" ))= (1300 , 4100 )) # 아래 플랏과 비교하기 위해 y축 범위를 고정
# 모형의 파라미터를 해석해 보면 2 ** mod_full.params[1 :5 ]
cut[T.Good]        1.08
cut[T.Very Good]   1.12
cut[T.Premium]     1.15
cut[T.Ideal]       1.17
dtype: float64
cut 대신 color와 clarity에 대해서도 그려볼 것
Residuals 분석
"lresid_full" ] = mod_full.resid
= 'lcarat' , y= 'lresid_full' )= .1 ))
이상치들만 자세히 들여다보면,
from numpy import abs "@abs(lresid_full) > 1" ).assign(= lambda x: 2 ** mod_full.predict(x[["lcarat" , "cut" , "color" , "clarity" ]]),= lambda x: x.price - x.pred_full,"resid_full" )
       carat      cut color clarity  depth  table  price    x    y    z  \
22440   2.46  Premium     E     SI2  59.70  59.00  10470 8.82 8.76 5.25
41918   1.03     Fair     E      I1  78.20  54.00   1262 5.72 5.59 4.42
38153   0.25     Fair     F     SI2  54.40  64.00   1013 4.30 4.23 2.32
...      ...      ...   ...     ...    ...    ...    ...  ...  ...  ...
5325    0.61     Good     F     SI2  62.50  65.00   3807 5.36 5.29 3.33
8203    0.51     Fair     F    VVS2  60.70  66.00   4368 5.21 5.11 3.13
21935   1.01     Fair     D     SI2  64.60  58.00  10011 6.25 6.20 4.02

       lprice  lcarat  lresid  lresid_full  pred_full  resid_full
22440   13.35    1.30   -1.02        -1.17   23630.26   -13160.26
41918   10.30    0.04   -1.96        -1.07    2650.65    -1388.65
38153    9.98   -2.00    1.15         1.94     264.51      748.49
...       ...     ...     ...          ...        ...         ...
5325    11.89   -0.71    0.90         1.31    1539.74     2267.26
8203    12.09   -0.97    1.53         1.36    1706.07     2661.93
21935   13.29    0.01    1.07         1.30    4052.40     5958.60

[16 rows x 16 columns]
좀 더 체계적으로 다음과 같이 모형의 복잡성 이 올라감에 따라 예측의 정확성이 어떻게 변하는지 알아보면
= diamonds.query("carat < 2.5" ).assign(= lambda x: np.log2(x.price), = lambda x: np.log2(x.carat)# Nested models = smf.ols("lprice ~ lcarat" , data= diamonds2).fit()= smf.ols("lprice ~ lcarat + clarity" , data= diamonds2).fit()= smf.ols("lprice ~ lcarat + cut + color + clarity" , data= diamonds2).fit()
code
= diamonds2.assign(= diamonds2_mod1.resid,= diamonds2_mod2.resid,= diamonds2_mod3.resid,= diamonds2_mods.melt(= ["lcarat" , "lprice" ],= ["mod1" , "mod2" , "mod3" ],= "model" ,= "resid" ,= 'lcarat' , y= 'resid' , color= 'model' )= .1 ))"model" )= (8 , 5 ))
code
= 'resid' , color= 'model' )= 50 ))= (5 , 3 ))
code
from statsmodels.tools.eval_measures import rmse, meanabs= [diamonds2_mod1, diamonds2_mod2, diamonds2_mod3]= diamonds2.priceprint ("The prediction accuracy of the models (original unit except R-squared): \n " )for i, mod in enumerate (mods):= 2 ** mod.fittedvalues= np.var(y_hat) / np.var(y)= mod.rsquaredprint (f"Model { i+ 1 } >> R-squared(log): { R2_log:.2f} , R_squared { R2:.2f} , " f"RMSE: { rmse(y, y_hat):.2f} , MAE: { meanabs(y, y_hat):.2f} "
The prediction accuracy of the models (original unit except R-squared):

Model 1 >> R-squared(log): 0.93, R_squared 0.88, RMSE: 1507.04, MAE:817.34
Model 2 >> R-squared(log): 0.97, R_squared 0.98, RMSE: 1164.81, MAE:623.65
Model 3 >> R-squared(log): 0.98, R_squared 0.95, RMSE: 732.70, MAE:390.61
The prediction accuracy of the models can be evaluated by the following metrics:The strength of association )
변량의 비율로 해석하고 싶다면,
\(\displaystyle\frac{V(predictions)}{V(Y)} + \frac{V(residuals)}{V(Y)} = 1,\) (OLS estimate)
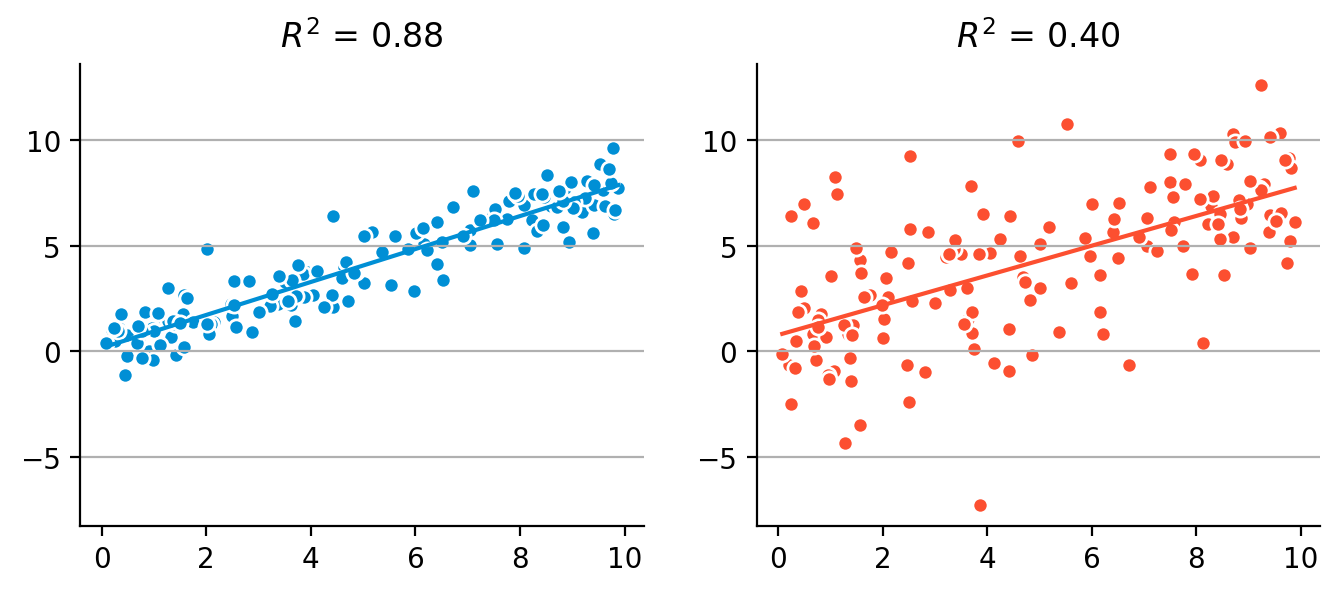
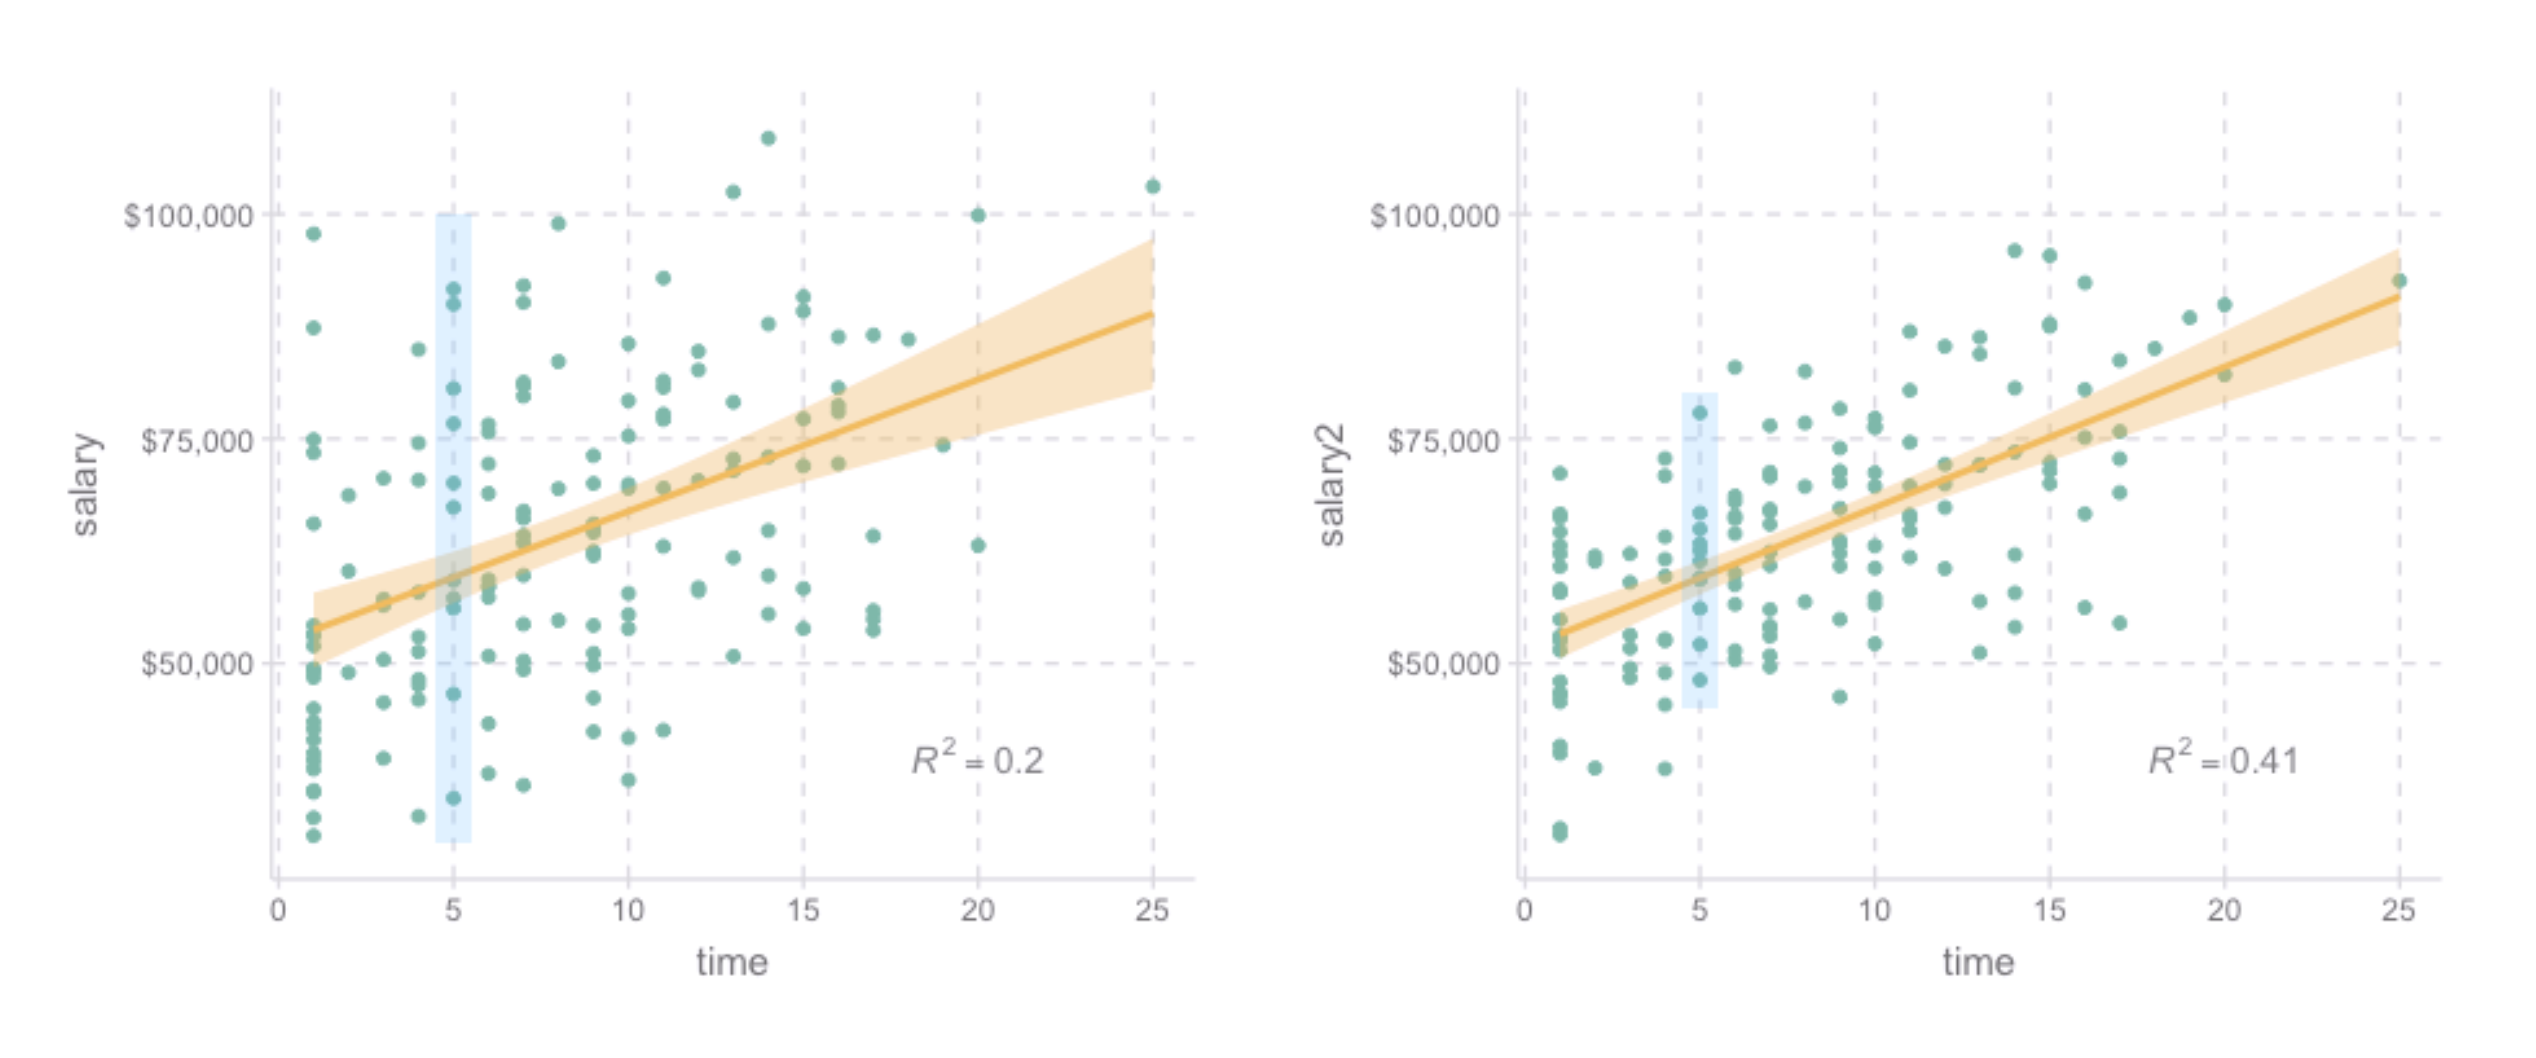
즉, “모형에 의해 설명되는 \(Y\) 변량의 비율 ” + “모형에 의해 설명되지 않는 \(Y\) 변량의 비율 ” = 1\(R^2\) 라고 하고, 결정계수 혹은 R squared라고 부름\(1-R^2\) 는 설명되지 않는 변량의 비율이라고 할 수 있음.\(또한, R\) 은 multiple correlation coefficient라고 부르는데, 이는 \(Y\) 와 예측값 \(\hat Y\) 의 상관계수(Pearson’s correlation coefficient)를 의미함.
비율이 아닌 \(Y\) 의 단위와 동일한 단위로 해석하고 싶다면,
Root-mean-squared deviation/error: \(RMSE = \displaystyle\sqrt{\frac{1}{n} \sum_{i=1}^{n}{(y_i -\hat y_i)^2}}\)
Mean absolute error: \(MAE = \displaystyle\frac{1}{n} \sum_{i=1}^{n}{|~y_i -\hat y_i~|}\) : 이상치에 덜 민감함
동일한 관계를 갖지만 예측정확성/설명력이 다른 경우의 예
Interactions
무게(carat)과 투명도(clarity)가 상호작용하여 가격에 영향을 준다는 가정하에, 즉, 투명도의 레벨에 따라 무게와 가격의 관계가 바뀔 수 있다는 가정
= smf.ols("lprice ~ lcarat + clarity" , data= diamonds2).fit()= smf.ols("lprice ~ lcarat * clarity" , data= diamonds2).fit()
Prediction 비교
code
= diamonds2.assign(= diamonds2_mod2.fittedvalues,= diamonds2_mod2_interact.fittedvalues,= diamonds2_mods.melt(= ["lcarat" , "lprice" , "clarity" ],= ["pred_add" , "pred_interact" ],= "model" ,= "pred" ,= 'lcarat' , y= 'pred' , color= 'clarity' )= so.Nominal(order= diamonds2.clarity.cat.categories.tolist()))"model" )= (8 , 4.5 ))
Residuals 비교
code
= diamonds2.assign(= diamonds2_mod2.resid,= diamonds2_mod2_interact.resid,= diamonds2_mods.melt(= ["lcarat" , "lprice" , "clarity" ],= ["resid_add" , "resid_interact" ],= "model" ,= "resid" ,= "lcarat" , y= "resid" , color= "clarity" )= 0.1 ))= (12 , 5 ))"clarity" , "model" )
두 가지 관점
모델 파라미터의 해석
변수와 변수간의 관계성에 초점
변수들을 “동시” 에 고려해서 봄으로써 각 변수들의 “고유한 impact”의 방향과 크기 를 해석하고자 함
ex. ols(lprice ~ lcarat + color + cut + clarity, data = diamonds2)
다이아몬드 투명도(clarity)의 레벨이 하나씩 올라감에 따라 가격형성에 어떻게 혹은 얼마나 영향을 주는가?
clarity[T.SI2]    0.59
clarity[T.SI1]    0.82
clarity[T.VS2]    1.04
                  ...
clarity[T.VVS1]   1.44
clarity[T.IF]     1.58
lcarat            1.89
Length: 8, dtype: float64
또한, 변수간의 상호작용 을 고려하여, 각 변수들의 “고유한 impact”의 방향과 크기 에 대해 정교한 분석이 가능
lcarat                   1.60
lcarat:clarity[T.SI2]    0.20
lcarat:clarity[T.SI1]    0.22
lcarat:clarity[T.VS2]    0.18
lcarat:clarity[T.VS1]    0.23
lcarat:clarity[T.VVS2]   0.25
lcarat:clarity[T.VVS1]   0.23
lcarat:clarity[T.IF]     0.27
dtype: float64
모델의 예측 정확성과 특성
Residuals의 분석
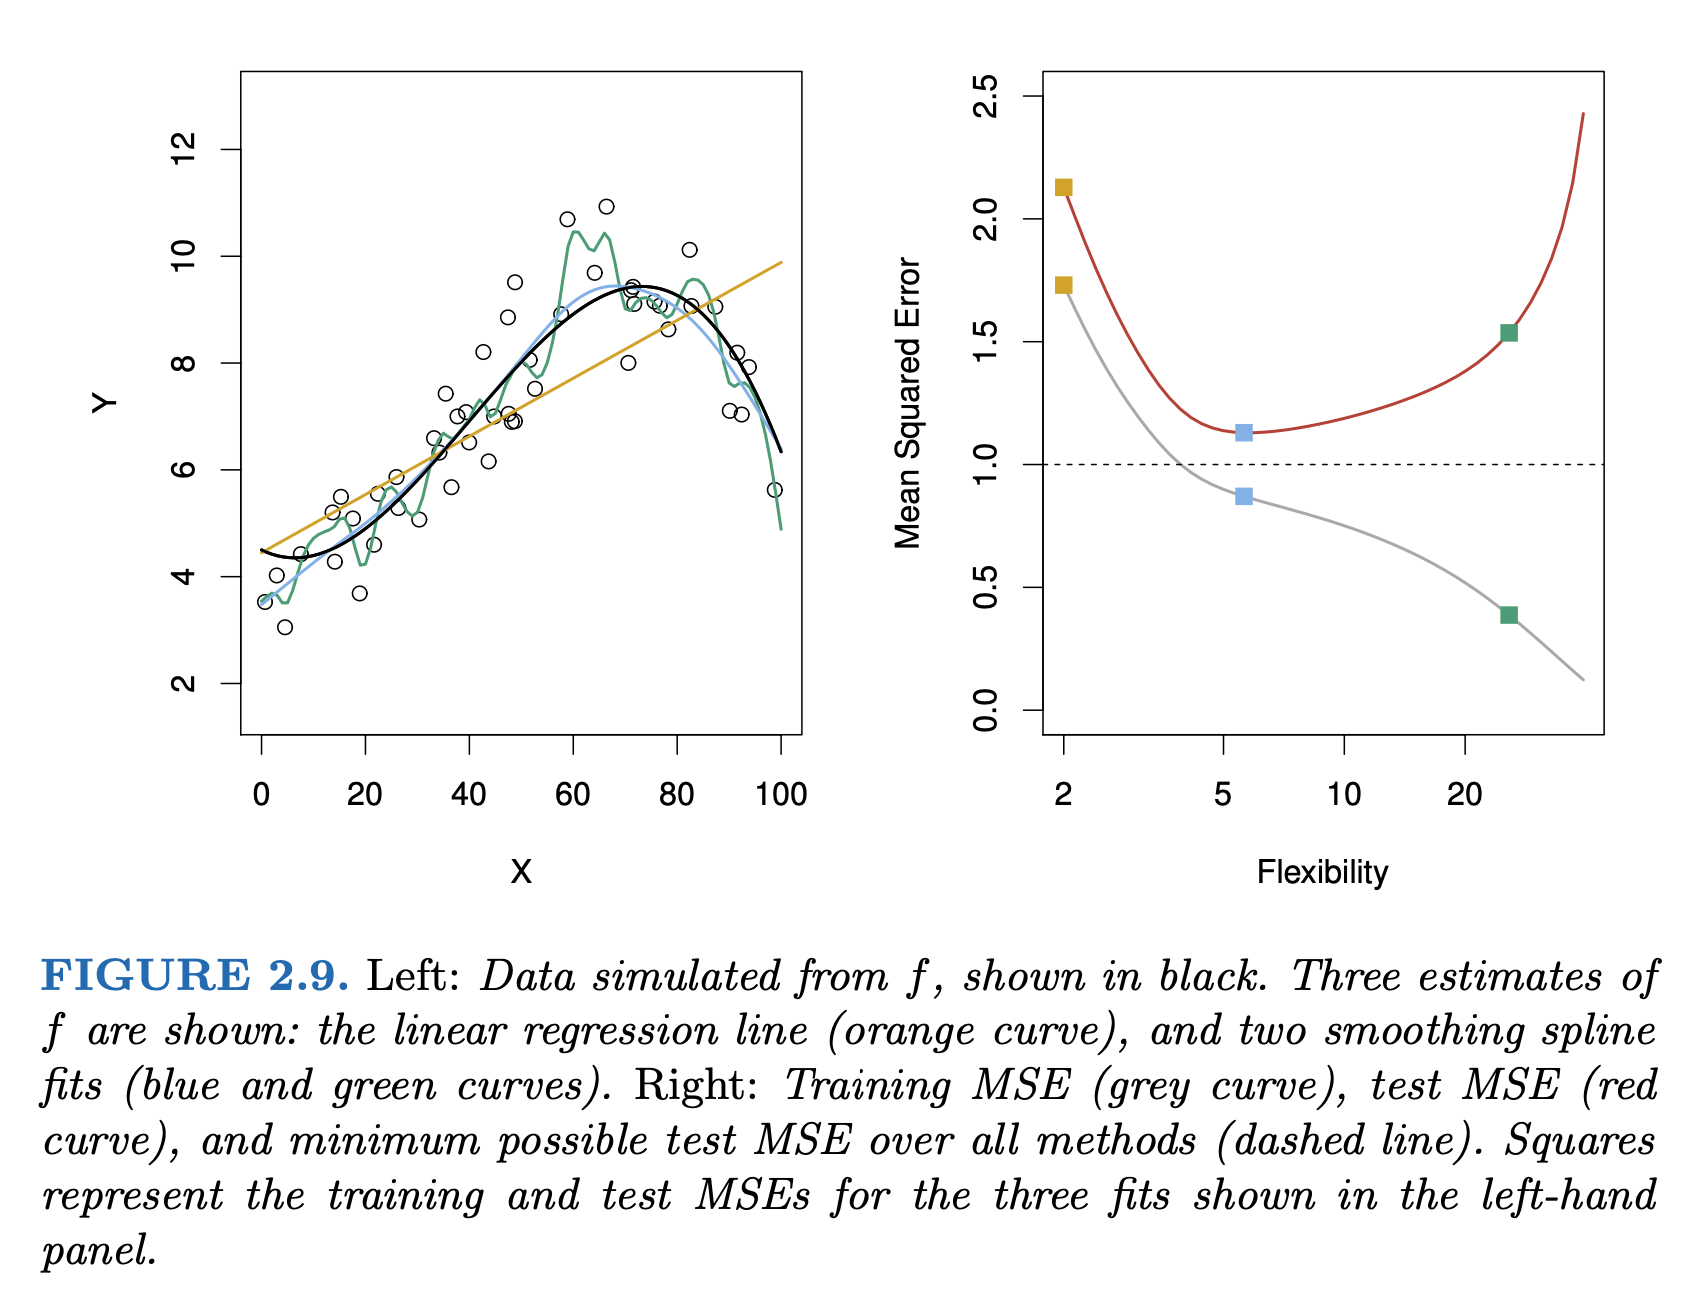
변수의 개수가 증가하면, 즉 모델이 복잡할수록 샘플에 대한 예측력은 높아짐.
Bias-Variance Tradeoff
An Introduction to Statistical Learning (2e) by Gareth James, Daniela Witten, Trevor Hastie, and Robert Tibshirani
Exercises
샌프란시스코행 항공편의 도착은 왜 지연되었는가? nycflights13
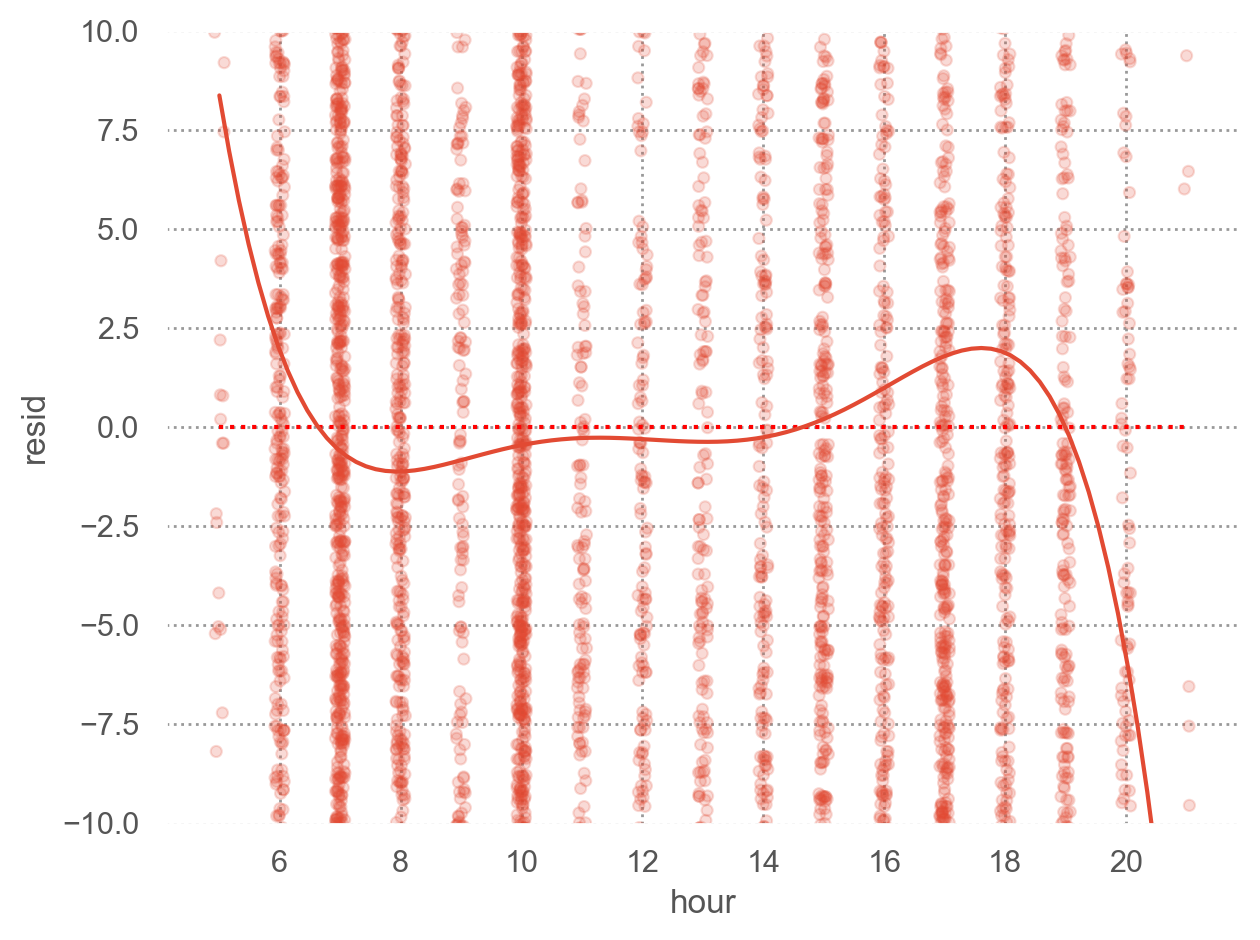
Linear model: arr_delay ~ hour + origin + carrier + season + dow
# import the data = sm.datasets.get_rdataset('flights' , 'nycflights13' ).data# convert the date column to a datetime object "time_hour" ] = pd.to_datetime(flights["time_hour" ])# add a column for the day of the week "dow" ] = ("time_hour" ]# 요일 추출 str [:3 ] # 요일 앞 3글자 "category" )"Sun" , "Mon" , "Tue" , "Wed" , "Thu" , "Fri" , "Sat" ])# add a column for the season "season" ] = np.where(flights["month" ].isin([6 , 7 ]), "summer" , "other month" )
# filter out the flights to SFO = flights.query('dest == "SFO" & arr_delay < 500' ).copy()
import statsmodels.formula.api as smf= smf.ols("arr_delay ~ hour + origin + carrier + season + dow" , data= sfo).fit()
다음 데이터셋에서 집값에 미치는 변수들에 대해 그 영향력 살펴보세요.
= sm.datasets.get_rdataset("SaratogaHouses" , "mosaicData" )= houses_data.data # data print (houses_data.__doc__) # description of the data
앞서 Model Basics 파트에서 다음과 같은 모형을 세웠는데, 그 적절성을 확인해보고, 상호작용 효과가 존재하는지를 포함해 이를 확장해보세요.
from statsmodels.formula.api import ols"livingArea2" ] = houses["livingArea" ] / 35.5 # 1평으로 변환 = ols("price ~ livingArea2 + bedrooms" , data= houses).fit()
Intercept      36667.90
livingArea2     4451.88
bedrooms      -14196.77
dtype: float64
= True )
OLS Regression Results
Dep. Variable:
price
R-squared:
0.515
Model:
OLS
Adj. R-squared:
0.515
No. Observations:
1728
F-statistic:
917.4
Covariance Type:
nonrobust
Prob (F-statistic):
4.31e-272
coef
std err
t
P>|t|
[0.025
0.975]
Intercept
3.667e+04
6610.293
5.547
0.000
2.37e+04
4.96e+04
livingArea2
4451.8772
125.210
35.555
0.000
4206.297
4697.457
bedrooms
-1.42e+04
2675.159
-5.307
0.000
-1.94e+04
-8949.872
Notes:
[1] Standard Errors assume that the covariance matrix of the errors is correctly specified.


