Load packages
# numerical calculation & data frames import numpy as npimport pandas as pd# visualization import matplotlib.pyplot as pltimport seaborn as snsimport seaborn.objects as so# statistics import statsmodels.api as sm# pandas options 'mode.copy_on_write' , True ) # pandas 2.0 = ' {:.2f} ' .format # pd.reset_option('display.float_format') = 7 # max number of rows to display # NumPy options = 2 , suppress= True ) # suppress scientific notation # For high resolution display import matplotlib_inline"retina" )
Numpy & pandas
Python 언어는 수치 계산을 위해 디자인되지 않았기 때문에, 데이터 분석에 대한 효율적이고 빠른 계산이 요구되면서 C/C++이라는 언어로 구현된 NumPy (Numerical Python)가 탄생하였고, Python 생태계 안에 통합되었음. 기본적으로 Python 언어 안에 새로운 언어라고 볼 수 있음. 데이터 사이언스에서의 대부분의 계산은 NumPy의 ndarray (n-dimensioal array)와 수학적 operator들을 통해 계산됨.
데이터 사이언스가 발전함에 따라 단일한 floating-point number들을 성분으로하는 array들의 계산에서 벗어나 칼럼별로 다른 데이터 타입(string, integer, object..)을 포함하는 tabular 형태의 데이터를 효율적으로 처리해야 할 필요성이 나타났고, 이를 다룰 수 있는 새로운 언어를 NumPy 위에 개발한 것이 pandas임. 이는 기본적으로 Wes Mckinney에 의해 독자적으로 개발이 시작되었으며, 디자인적으로 불만족스러운 점이 지적되고는 있으나 데이터 사이언스의 기본적인 언어가 되었음.
NumPy와 pandas에 대한 자세한 내용은 Python for Data Analysis by Wes MacKinney 참고
NumPy
수학적 symbolic 연산에 대한 구현이라고 볼 수 있으며,
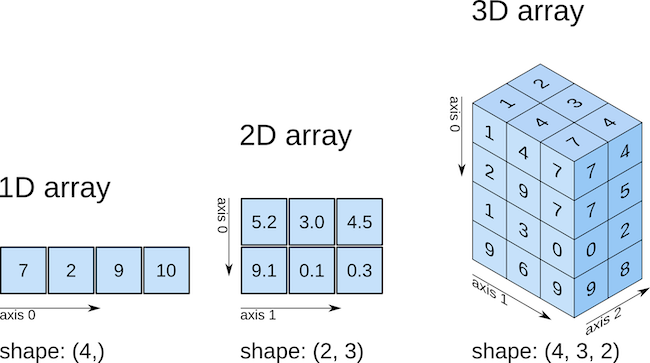
행렬(matrix) 또는 벡터(vector)를 ndarray (n-dimensional array)이라는 이름으로 구현함.
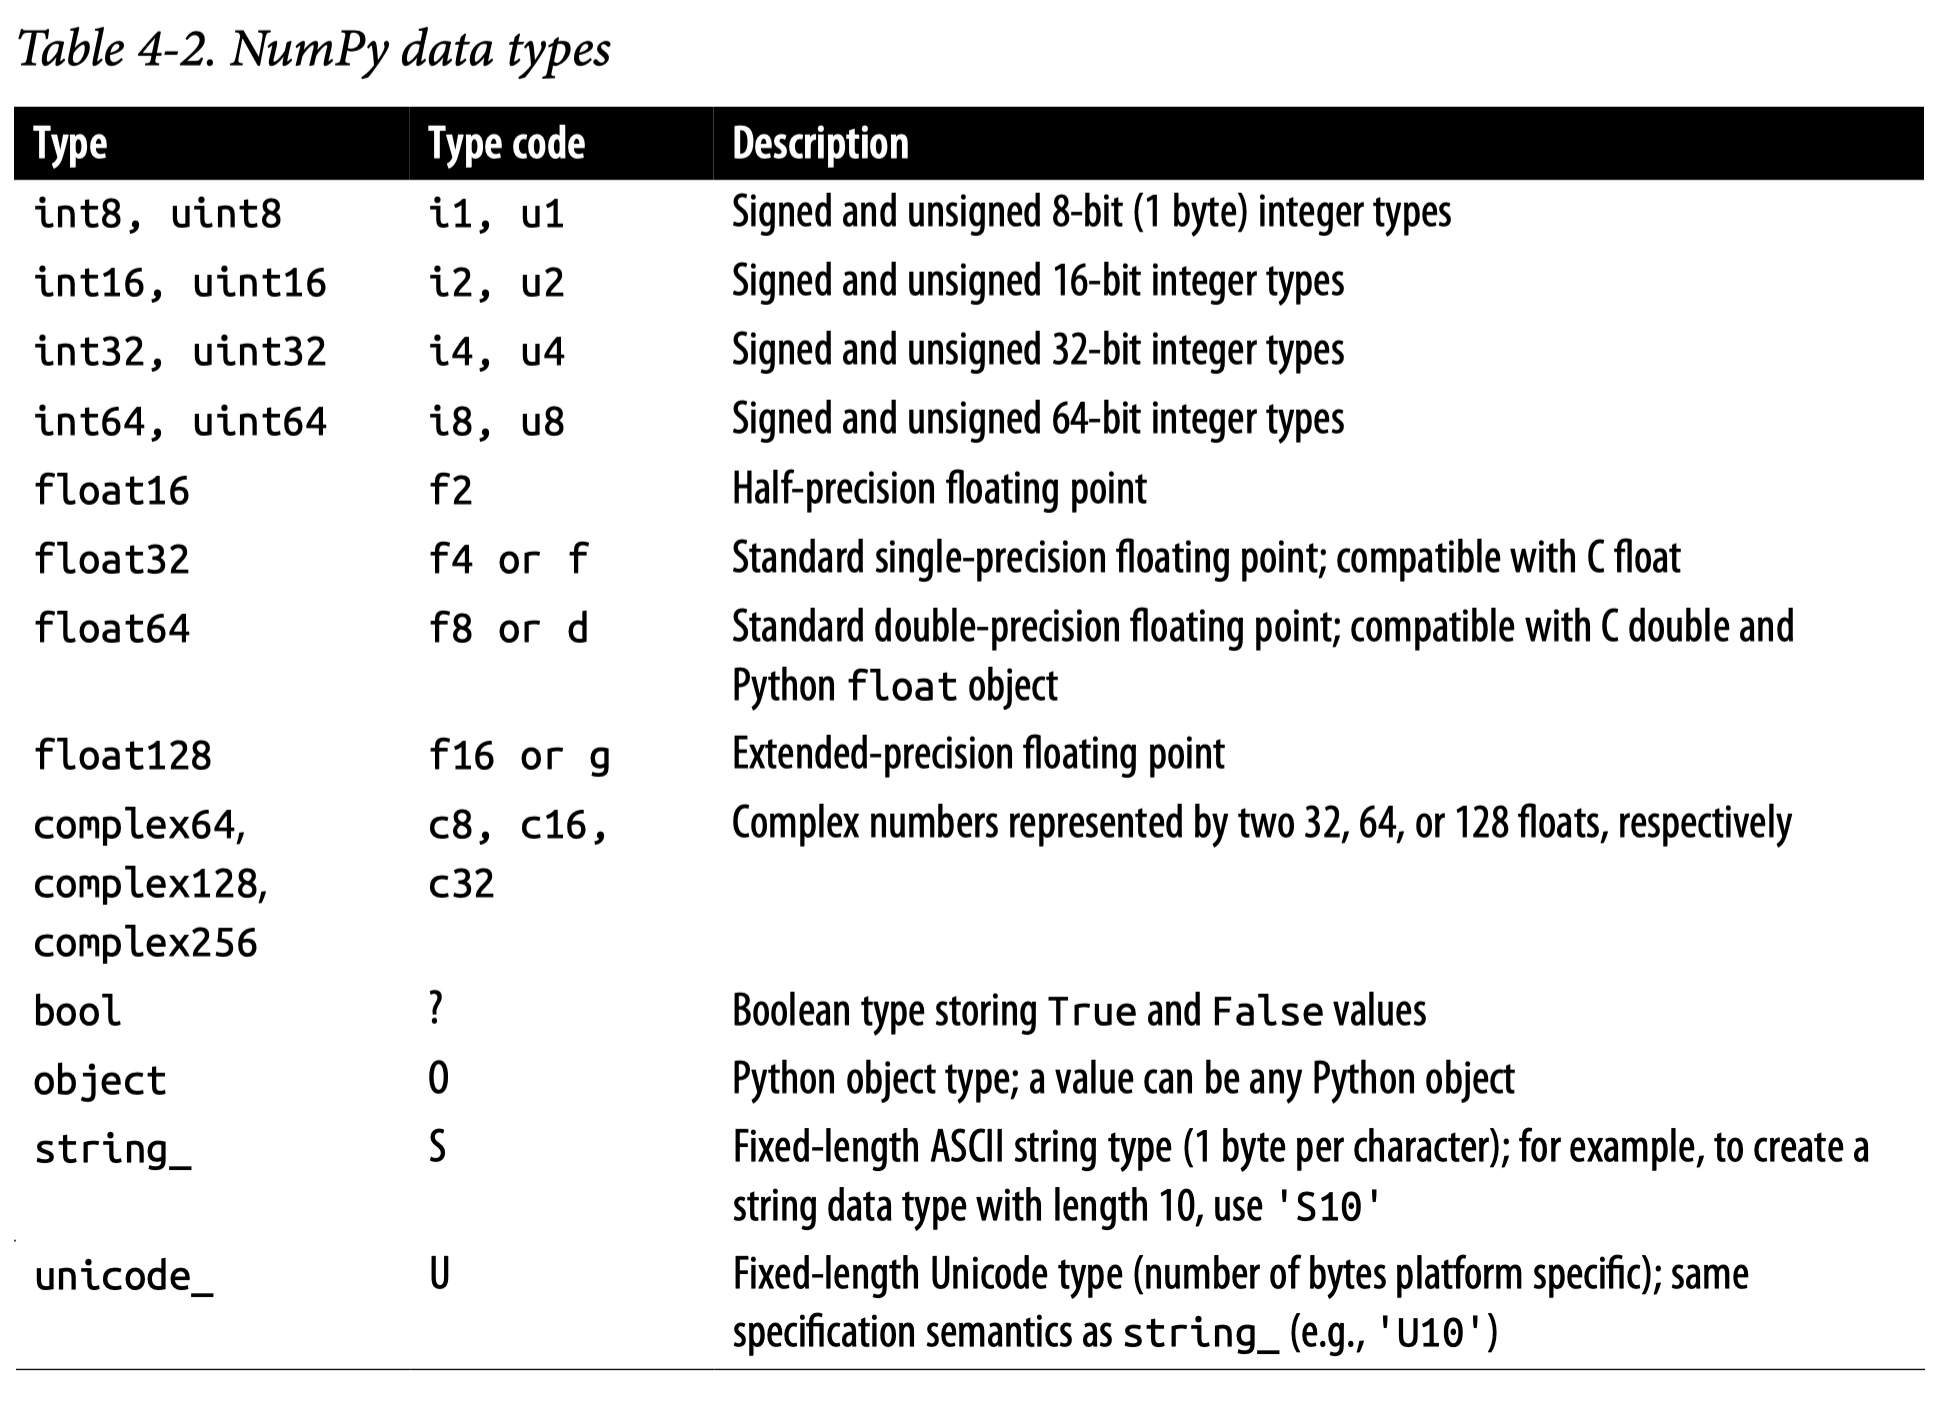
사실상 정수(int)나 실수(float)의 한가지 타입으로 이루어짐.
고차원의 arrays 가능Medium.com
가령, 다음과 같은 행렬 연산이 있다면,\(\begin{bmatrix}1 & 2 \\ 3 & 4 \\ 5 & 6 \end{bmatrix} \begin{bmatrix}2 \\ -1 \end{bmatrix} = \begin{bmatrix}0 \\ 2 \\ 4 \end{bmatrix}\)
= np.array([[1 , 2 ],3 , 4 ],5 , 6 ]]) # 3x2 matrix = np.array([[2 ],- 1 ]]) # 2x1 matrix @ X # A * X : matrix multiplication
Vector vs. Matrix
print (np.array([0 , 2 , 4 ])) # 1-dim matrix: vector print (np.array([0 , 2 , 4 ]).reshape(3 , 1 )) # 3x1 matrix
= np.array([0 , 2 , 4 ])3 , - 1 ).T
= np.array([2 , - 1 ])@ X2 # same as A.dot(X2)
print (A.shape)print (A.ndim)print (A.dtype)
+ A # element-wise addition
array([[ 2,  4],
       [ 6,  8],
       [10, 12]])
array([[ 1,  3],
       [ 5,  7],
       [ 9, 11]])
array([[  2.72,   7.39],
       [ 20.09,  54.6 ],
       [148.41, 403.43]])
Python vs. NumPy
= 2 ** 31 - 1 print (a)print (a + 1 )
= np.array([2 ** 31 - 1 ], dtype= 'int32' )print (a)print (a + 1 )
[2147483647]
[-2147483648]
Ch.4 in Python for Data Analysis (3e) by Wes McKinney
pandas
Series & DataFrame
Series
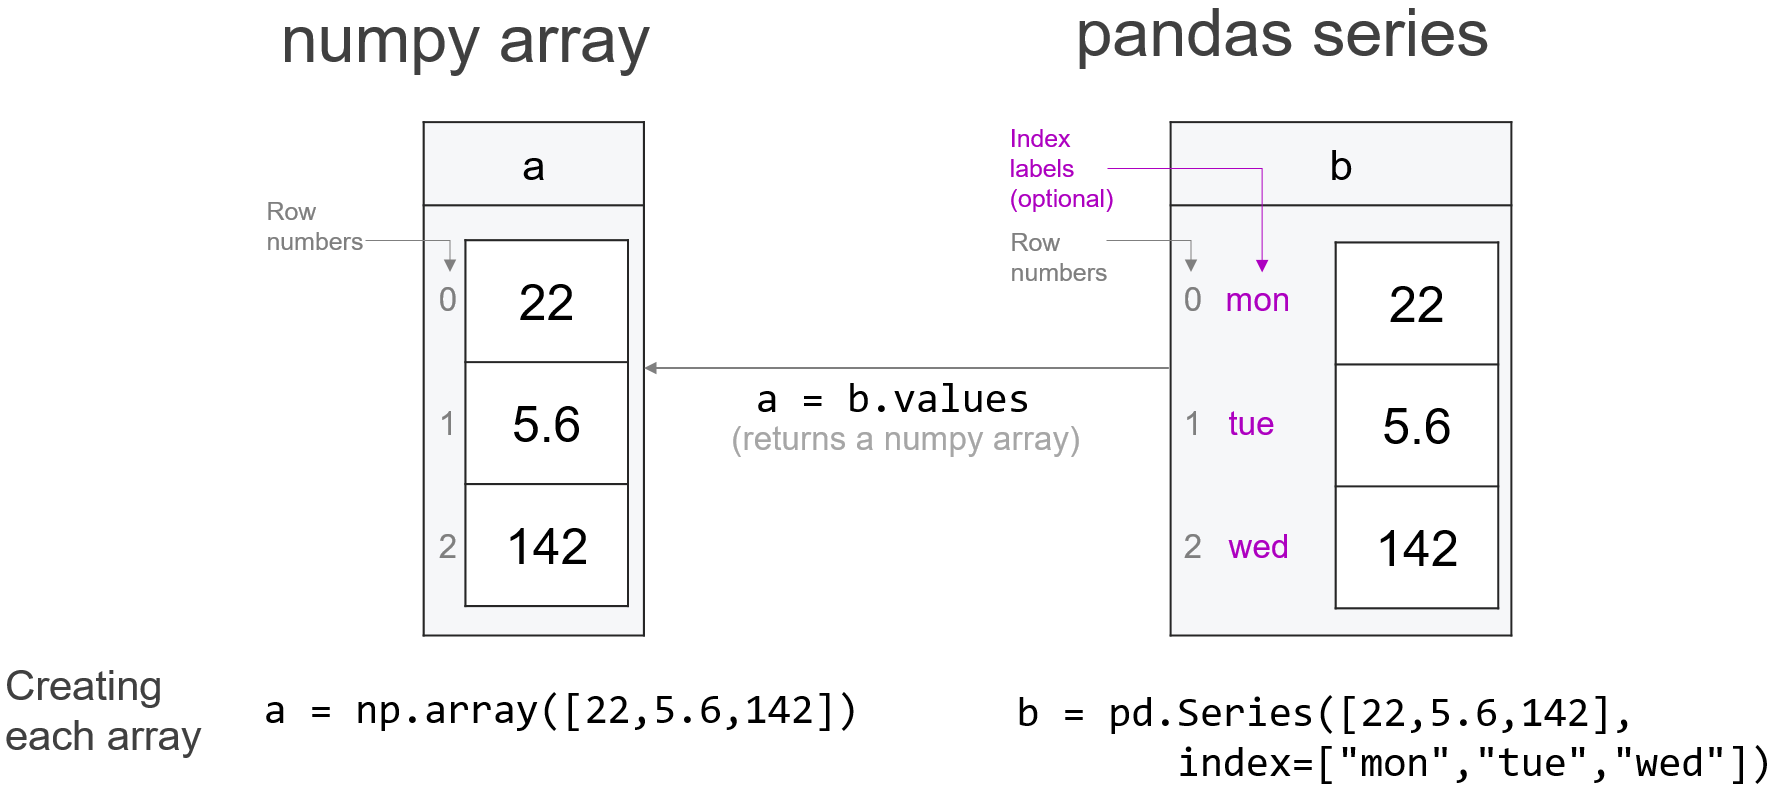
1개의 칼럼으로 이루어진 데이터 포멧: 1d numpy array에 labels을 부여한 것으로 볼 수 있음.
Practical Data Science
DataFrame
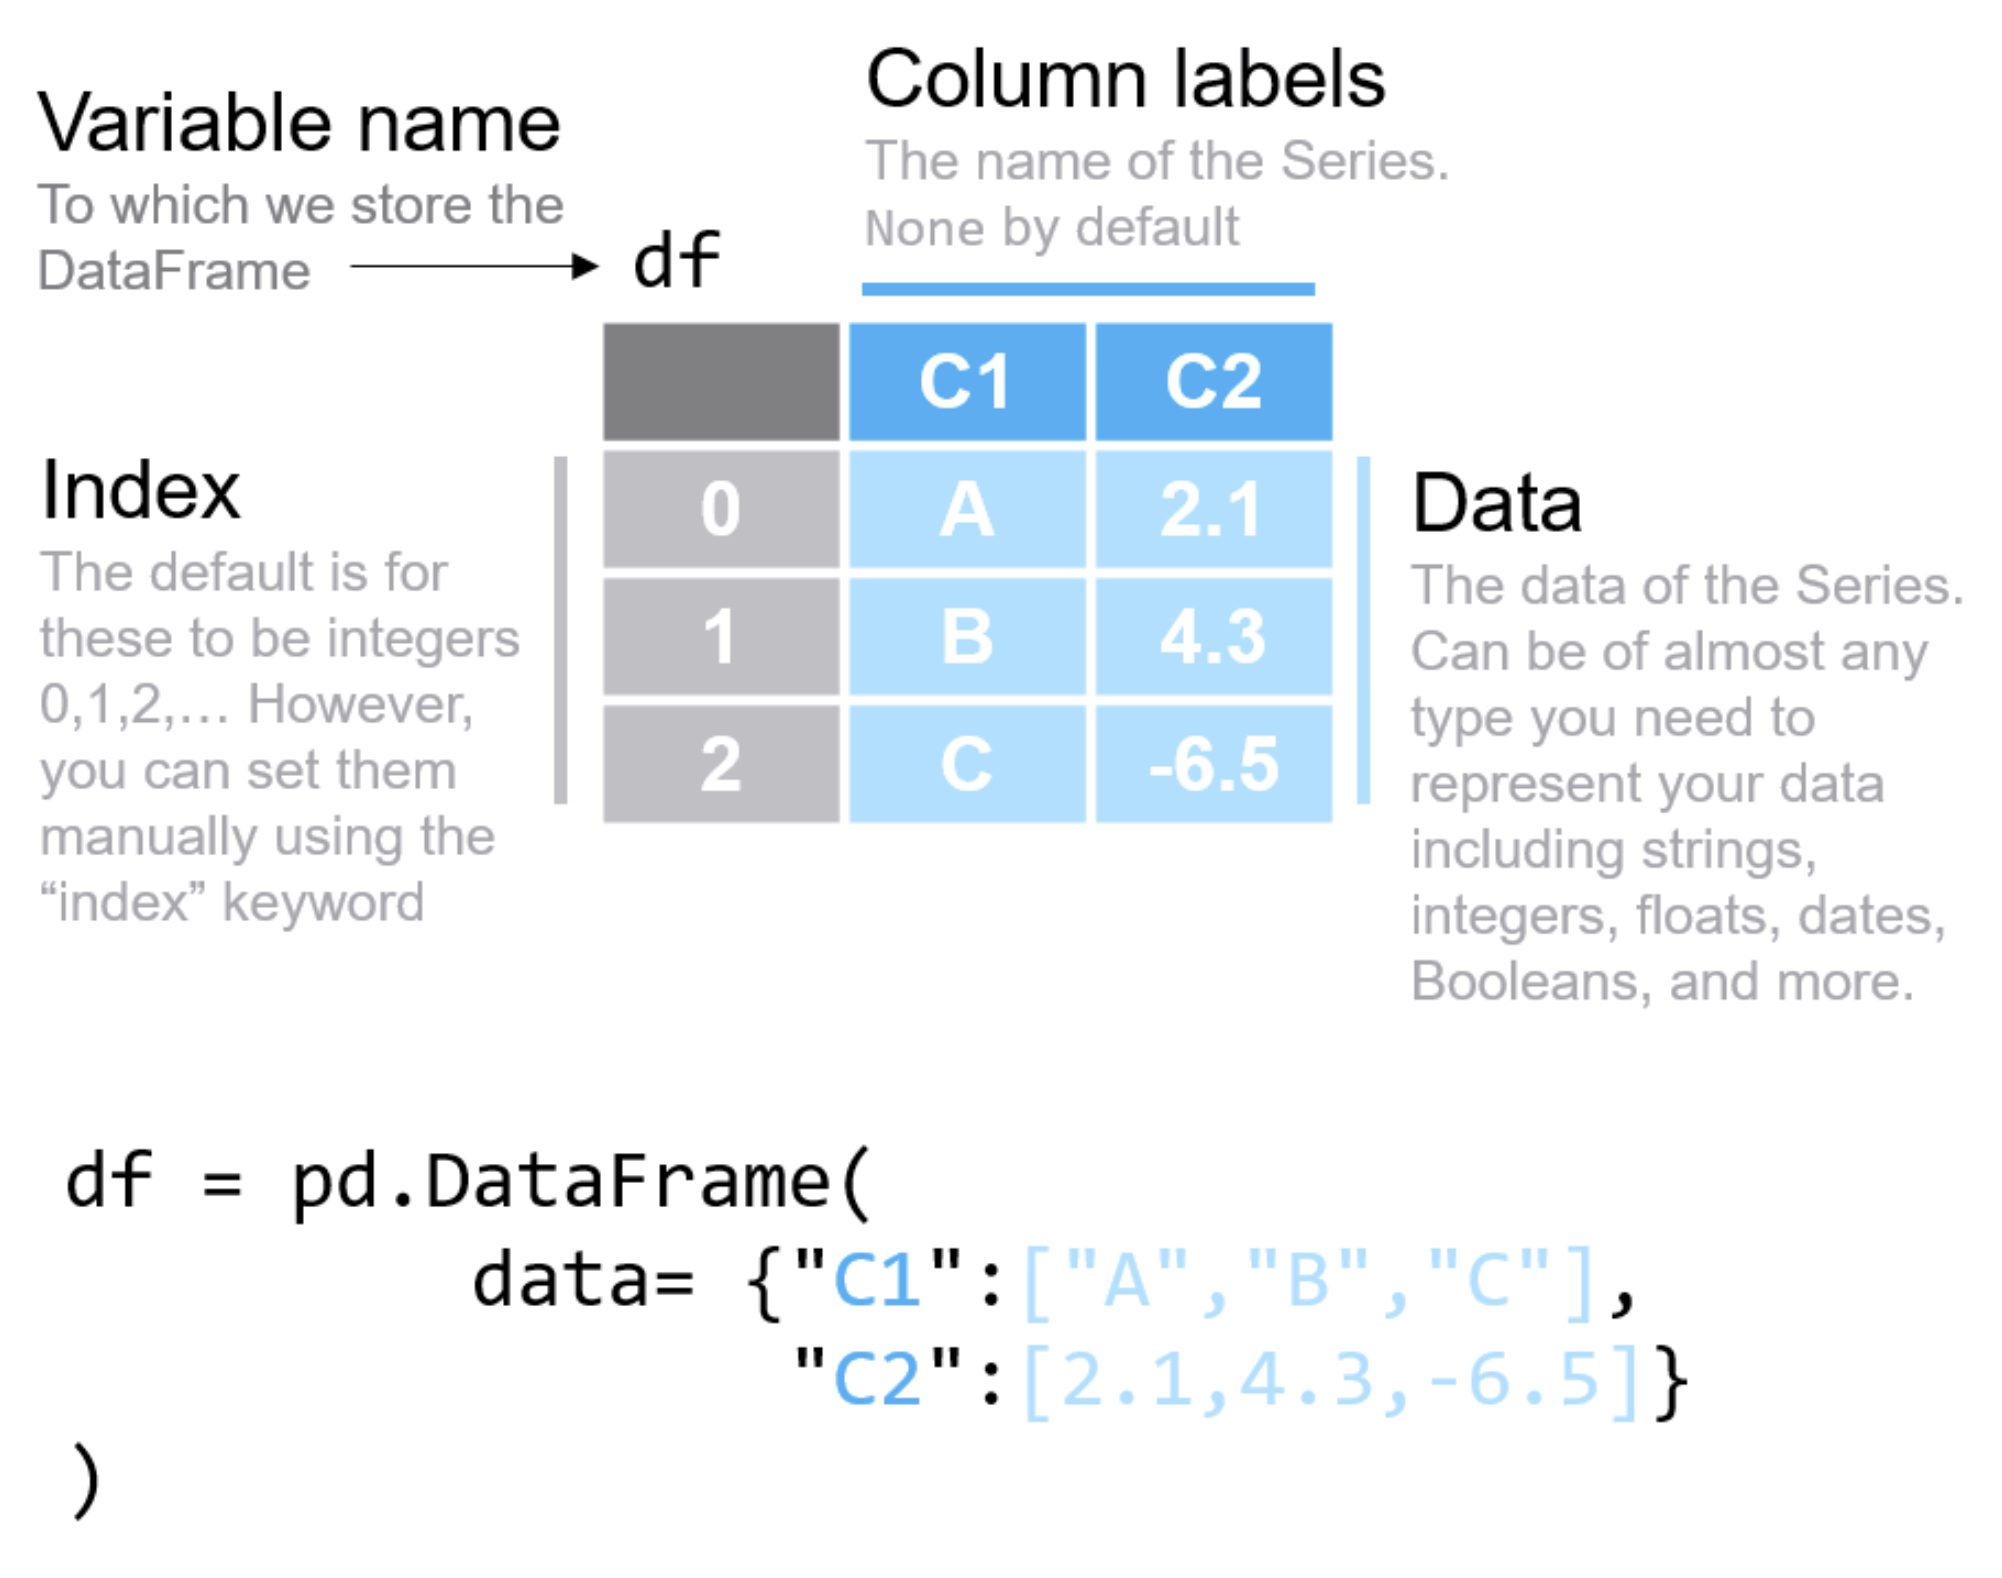
각 칼럼들이 한 가지 데이터 타입으로 이루어진 tabular형태 (2차원)의 데이터 포맷
각 칼럼은 기본적으로 한 가지 데이터 타입인 것이 이상적이나, 다른 타입이 섞여 있을 수 있음
NumPy의 2차원 array의 각 칼럼에 labels을 부여한 것으로 볼 수도 있으나, 여러 다른 기능들이 추가됨
NumPy의 경우 고차원의 array를 다룰 수 있음: ndarray
고차원의 DataFrame과 비슷한 것은 xarray가 존재
Labels와 index를 제외한 데이터 값은 거의 NumPy ndarray로 볼 수 있음
Practical Data Science
ndarray <> DataFrame
= pd.DataFrame(A, columns= ["A1" , "A2" ])
# 데이터 값들은 NumPy array # 또는 df.to_numpy()
array([[1, 2],
       [3, 4],
       [5, 6]])
pandas.core.frame.DataFrame
Columns
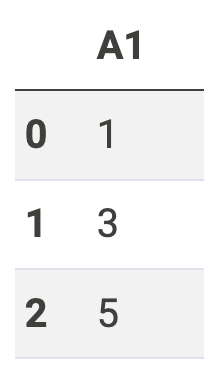
Series로 추출
= df["A1" ] # A1 칼럼 선택 # DataFrame의 column 이름이 Series의 name으로 전환
0    1
1    3
2    5
Name: A1, dtype: int64
pandas.core.series.Series
# Series의 값은 1d array
df[["A1"]] # double brackets
Index objects
= pd.DataFrame(np.arange(6 ).reshape((2 , 3 )),= pd.Index(["Ohio" , "Colorado" ], name= "state" ),= pd.Index(["one" , "two" , "three" ], name= "number" ))
number    one  two  three
state
Ohio        0    1      2
Colorado    3    4      5
Index(['Ohio', 'Colorado'], dtype='object', name='state')
# columns도 index object
Index(['one', 'two', 'three'], dtype='object', name='number')
“number”: columns의 이름
frame.columns.name #> ‘number’frame.index.name #> ‘state’
Multi-Index object
Index는 여러 levels을 지닐 수 있음
# stack()은 long form으로 변환 # 2 levels의 index를 가진 Series
state     number
Ohio      one       0
          two       1
          three     2
Colorado  one       3
          two       4
          three     5
dtype: int64
# MultiIndex를 직접 구성 12 ).reshape((4 , 3 )),= pd.MultiIndex.from_arrays([["a" , "a" , "b" , "b" ], [1 , 2 , 1 , 2 ]], names= ["idx1" , "idx2" ]),= pd.MultiIndex.from_arrays([["Ohio" , "Ohio" , "Colorado" ], ["Green" , "Red" , "Green" ]], names= ["state" , "color" ]))
state      Ohio     Colorado
color     Green Red    Green
idx1 idx2
a    1        0   1        2
     2        3   4        5
b    1        6   7        8
     2        9  10       11
Time Series
Index는 times series에 특화
파일 다운로드: Bike Sharing in Washington D.C. Dataset
= pd.read_csv('../data/day.csv' , index_col= 'dteday' , parse_dates= True )3 )
            instant  season  yr  mnth  holiday  weekday  workingday  \
dteday
2011-01-01        1       1   0     1        0        6           0
2011-01-02        2       1   0     1        0        0           0
2011-01-03        3       1   0     1        0        1           1

            weathersit  temp  atemp  hum  windspeed  casual  registered   cnt
dteday
2011-01-01           2  0.34   0.36 0.81       0.16     331         654   985
2011-01-02           2  0.36   0.35 0.70       0.25     131         670   801
2011-01-03           1  0.20   0.19 0.44       0.25     120        1229  1349
= 'line' , y= ['casual' , 'registered' ], figsize= (7 , 4 ), title= 'Bike Sharing' )
index없이 분석 가능?
Index를 column으로 전환시켜 분석할 수 있음: .reset_index()
        dteday  instant  season  yr  mnth  holiday  weekday  workingday  \
0   2011-01-01        1       1   0     1        0        6           0
1   2011-01-02        2       1   0     1        0        0           0
2   2011-01-03        3       1   0     1        0        1           1
..         ...      ...     ...  ..   ...      ...      ...         ...
728 2012-12-29      729       1   1    12        0        6           0
729 2012-12-30      730       1   1    12        0        0           0
730 2012-12-31      731       1   1    12        0        1           1

     weathersit  temp  atemp  hum  windspeed  casual  registered   cnt
0             2  0.34   0.36 0.81       0.16     331         654   985
1             2  0.36   0.35 0.70       0.25     131         670   801
2             1  0.20   0.19 0.44       0.25     120        1229  1349
..          ...   ...    ...  ...        ...     ...         ...   ...
728           2  0.25   0.24 0.75       0.12     159        1182  1341
729           1  0.26   0.23 0.48       0.35     364        1432  1796
730           2  0.22   0.22 0.58       0.15     439        2290  2729

[731 rows x 16 columns]
반대로 column을 index로 전환: .set_index("column")
"dteday" )
            instant  season  yr  mnth  holiday  weekday  workingday  \
dteday
2011-01-01        1       1   0     1        0        6           0
2011-01-02        2       1   0     1        0        0           0
2011-01-03        3       1   0     1        0        1           1
...             ...     ...  ..   ...      ...      ...         ...
2012-12-29      729       1   1    12        0        6           0
2012-12-30      730       1   1    12        0        0           0
2012-12-31      731       1   1    12        0        1           1

            weathersit  temp  atemp  hum  windspeed  casual  registered   cnt
dteday
2011-01-01           2  0.34   0.36 0.81       0.16     331         654   985
2011-01-02           2  0.36   0.35 0.70       0.25     131         670   801
2011-01-03           1  0.20   0.19 0.44       0.25     120        1229  1349
...                ...   ...    ...  ...        ...     ...         ...   ...
2012-12-29           2  0.25   0.24 0.75       0.12     159        1182  1341
2012-12-30           1  0.26   0.23 0.48       0.35     364        1432  1796
2012-12-31           2  0.22   0.22 0.58       0.15     439        2290  2729

[731 rows x 15 columns]
DataFrame의 연산
NumPy의 ndarray들이 연산되는 방식과 동일하게 series나 DataFrame들의 연산 가능함
   A1  A2
0   3   6
1   9  12
2  15  18
    A1   A2
0 0.00 0.69
1 1.10 1.39
2 1.61 1.79
사실 연산은 index를 align해서 시행됨
number    one  two  three
state
Ohio        0    1      2
Colorado    3    4      5
number  one  two  three
state
Ohio      0    2      4
Floria    6    8     10
number    one  two  three
state
Colorado  NaN  NaN    NaN
Floria    NaN  NaN    NaN
Ohio     0.00 3.00   6.00
(참고) Mixed Data Type
= pd.Series([1 , 2 , "3" ])
0     2
1     4
2    33
dtype: object
= s.astype("int" )+ s_int
= pd.Series([1 , 2 , 3.1 ])
Missing
NaN, NA, None
pandas에서는 missing을 명명하는데 R의 컨벤션을 따라 NA (not available)라 부름.
대부분의 경우에서 NumPy object NaN(np.nan)을 NA을 나타내는데 사용됨.
np.nan은 실제로 floating-point 의 특정 값으로 float64 데이터 타입임. Integer 또는 string type에서 약간 이상하게 작동될 수 있음.Python object인 None은 pandas에서 NA로 인식함.
현재 NA라는 새로운 pandas object 실험 중임
NA의 handling에 대해서는 교재 참고.dropna(), .fillna(), .isna(), .notna()
= pd.Series([1 , 2 , np.nan])
0   1.00
1   2.00
2    NaN
dtype: float64
# type을 변환: float -> int "Int64" )
0       1
1       2
2    <NA>
dtype: Int64
= pd.Series(["a" , "b" , np.nan])
0      a
1      b
2    NaN
dtype: object
# type을 변환: object -> string "string" )
0       a
1       b
2    <NA>
dtype: string
= pd.Series([1 , 2 , np.nan, None , pd.NA])
0       1
1       2
2     NaN
3    None
4    <NA>
dtype: object
Missing인지를 확인: .isna(), .notna()
0    False
1    False
2     True
3     True
4     True
dtype: bool
# or s.notnull()
0     True
1     True
2    False
3    False
4    False
dtype: bool
pandas에서는 ExtensionDtype이라는 새로운 데이터 타입이 도입되었음.
= pd.Series([2 , pd.NA], dtype= pd.Int8Dtype())# date type 확인
import pyarrow as pa= pd.Series([2 , pd.NA], dtype= pd.ArrowDtype(pa.uint16()))
pandas dtypes 참고
Python object인 None의 경우
NumPy object인 np.nan의 경우
== np.nan#> False
Attributes
자주 사용되는 attributes;
Series objects: name, dtype, shape, index, valuesname, dtype, shape, values, is_uniquedtype, shape, index, columns, values
