Load packages
# numerical calculation & data frames import numpy as npimport pandas as pd# visualization import matplotlib.pyplot as pltimport seaborn as snsimport seaborn.objects as so# statistics import statsmodels.api as sm# pandas options 'mode.copy_on_write' , True ) # pandas 2.0 = ' {:.2f} ' .format # pd.reset_option('display.float_format') = 8 # max number of rows to display # NumPy options = 2 , suppress= True ) # suppress scientific notation # For high resolution display import matplotlib_inline"retina" )
MovieLens 1M Dataset
Source: MovieLens 1M movie ratings
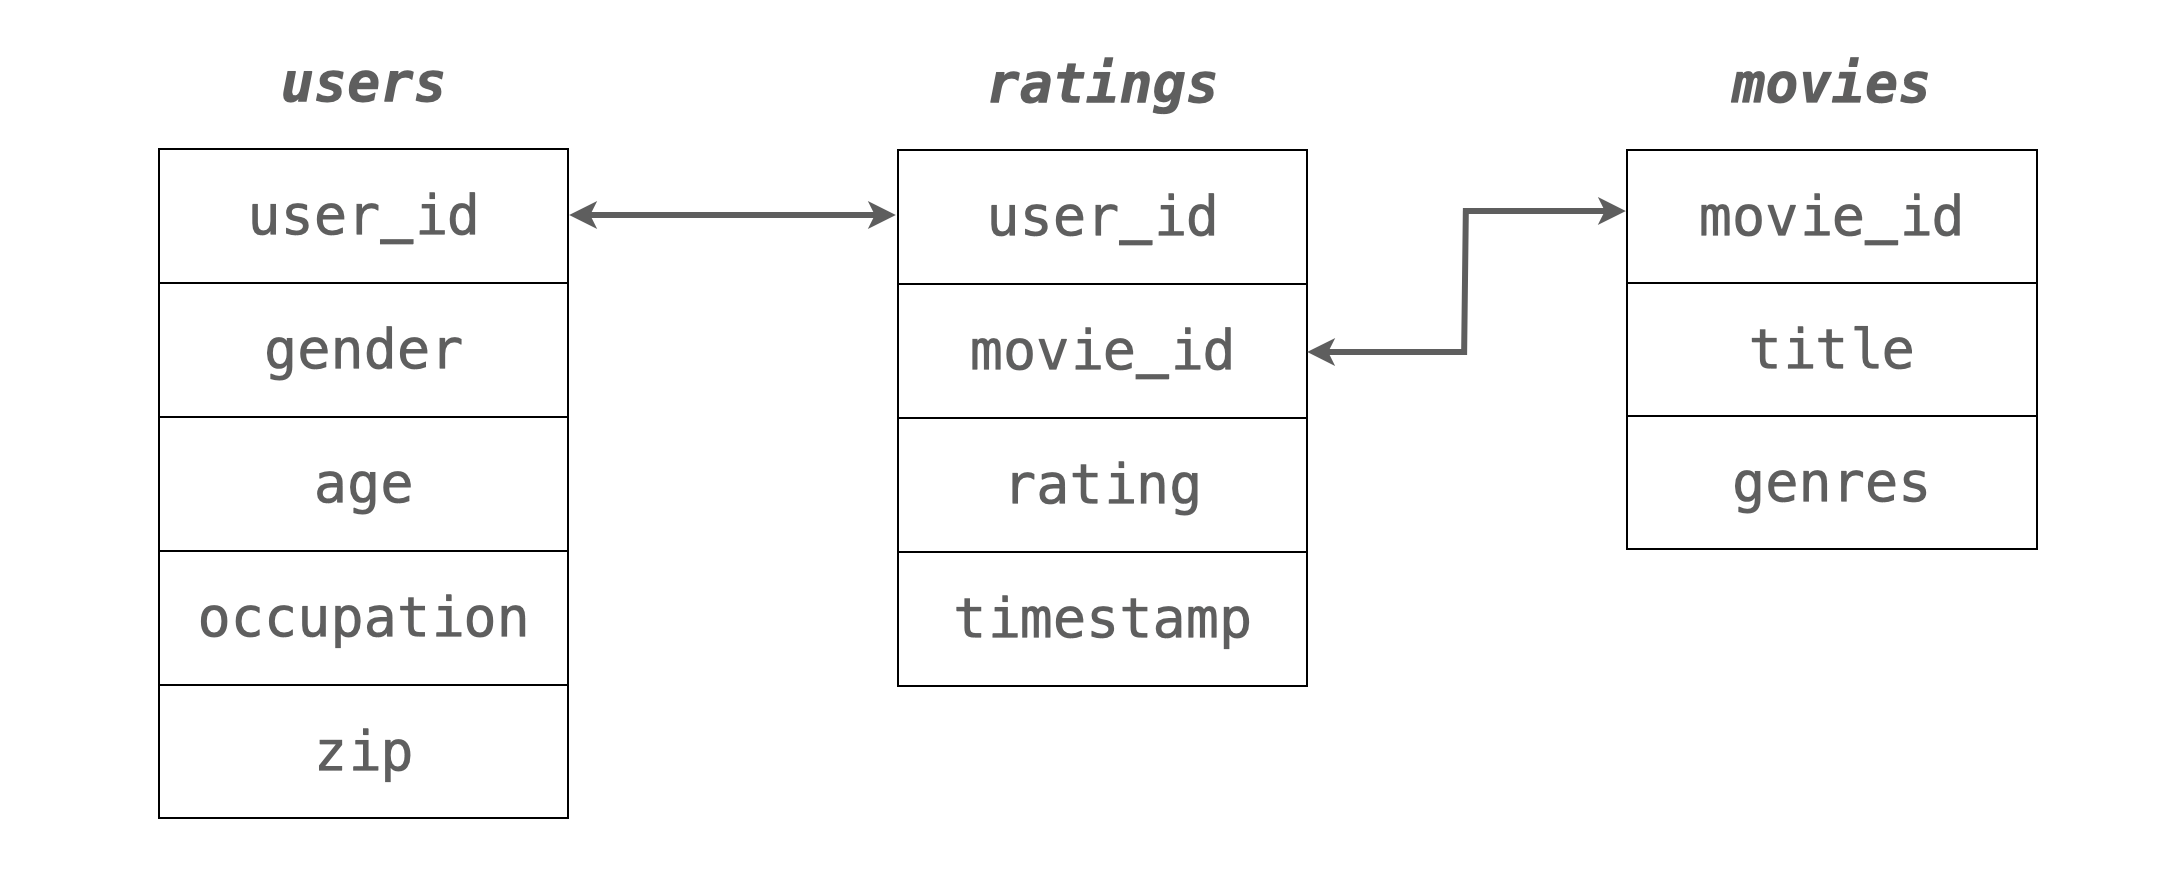
1990년대 후반에서 2000년대 초반의 영화 평가에 대한 3개의 relational data로 이루어져 있고,user_id, movie_id의 keys로 연결되어 있습니다.
users: 유저에 대한 정보ratings: 평점에 대한 정보movies: 영화에 대한 정보
ratings과 users 데이터를 merge한 후 user_rating 데이터셋을 만드세요.
= pd.merge(users, ratings)
         user_id gender  age  occupation    zip  movie_id  rating  timestamp
0              1      F    1          10  48067      1193       5  978300760
1              1      F    1          10  48067       661       3  978302109
2              1      F    1          10  48067       914       3  978301968
3              1      F    1          10  48067      3408       4  978300275
...          ...    ...  ...         ...    ...       ...     ...        ...
1000205     6040      M   25           6  11106      1094       5  956704887
1000206     6040      M   25           6  11106       562       5  956704746
1000207     6040      M   25           6  11106      1096       4  956715648
1000208     6040      M   25           6  11106      1097       4  956715569

[1000209 rows x 8 columns]
다음과 같이 영화(movie_id)별로 남녀(gender)에 따른 rating의 평균과 그 개수(count)을 구해보세요.
= ("movie_id" , "gender" ])["rating" ]"mean" , "count" ])6 )
   movie_id gender  mean  count
0         1      F  4.19    591
1         1      M  4.13   1486
2         2      F  3.28    176
3         2      M  3.18    525
4         3      F  3.07    136
5         3      M  2.99    342
다음과 같이 평가의 수가 적을수록 그 편차가 커지는 현상을 확인해보세요. 평가의 수가 많은 영화일수록 평가가 높아지는 현상에 대해 설명할 수 있을까요? 또한, 남녀의 평가에 차이가 벌어지는 현상을 설명할 수 있을까요?
= "count" , y= "mean" , color= "gender" )= .1 ))5 ))= "Dark2" )
유명한/잘 만든 영화를 더 많이 봐서? 좋게 본 영화는 더 평점을 내리는 경향이 있어서?
# 남녀 총 평점 수를 고려해서 비율로 보면 "total" ] = mean_ratings.groupby("gender" )["count" ].transform("sum" )= mean_ratings.assign(= lambda x: x["count" ] / x["total" ]
      movie_id gender  mean  count   total  prop
0            1      F  4.19    591  246440  0.00
1            1      M  4.13   1486  753769  0.00
2            2      F  3.28    176  246440  0.00
3            2      M  3.18    525  753769  0.00
...        ...    ...   ...    ...     ...   ...
7148      3951      F  3.71     17  246440  0.00
7149      3951      M  4.04     23  753769  0.00
7150      3952      F  3.76    105  246440  0.00
7151      3952      M  3.79    283  753769  0.00

[7152 rows x 6 columns]
= "prop" , y= "mean" , color= "gender" )= .1 ))5 ))# .scale(color="Dark2", x="log") # log scale = (2 , 4.5 ))
3번에서 seaborn.objects에 .limit(x=(0, 500), y=(2.5, 4.5))을 추가하여 평가 개수(count)가 0에서 500사이이고, 평균 rating이 2.5에서 4.5 사이인 것으로 확대해서 보고, 평가 개수가 몇 개 정도부터 남녀의 평가의 차이가 대략 일정하게 되는지 살펴보세요.
= "count" , y= "mean" , color= "gender" )= .1 ))5 ))= "Dark2" )= (0 , 500 ), y= (2.5 , 4.5 ))
영화별로 남녀의 평가가 크게 갈리는 영화들을 찾기 위해
5.1 2번에서 구한 데이터에서 남녀 모두 rating이 300개 이상 있는 영화로만 간추려보세요.
5.2 이 데이터를 popular_movies라고 명명하고,
이 데이터를 gender에 관해 wide format으로 변환한 후; pivot()을 이용
여자의 평균 rating에서 남자의 평균 rating을 뺀 그 차이를 데이터에 추가한 후; assign()을 이용
그 차이로 sort한 후,
5.3 여자의 선호가 더 높은 영화 5편과 남자의 선호가 더 높은 영화 5편 (선호 차이의 크기 순서로)을 구해보세요.
이를 위해서 movies 테이블 안의 영화제목(title)을 merge()를 이용해 추가하세요.
5.1 2번에서 구한 데이터에서 남녀 모두 rating이 300개 이상 있는 영화로만 간추려보세요.
      movie_id gender  mean  count   total  prop
0            1      F  4.19    591  246440  0.00
1            1      M  4.13   1486  753769  0.00
2            2      F  3.28    176  246440  0.00
3            2      M  3.18    525  753769  0.00
...        ...    ...   ...    ...     ...   ...
7148      3951      F  3.71     17  246440  0.00
7149      3951      M  4.04     23  753769  0.00
7150      3952      F  3.76    105  246440  0.00
7151      3952      M  3.79    283  753769  0.00

[7152 rows x 6 columns]
# groupby .filter()를 이용 = ("movie_id" , group_keys= False )filter (lambda x: (x["count" ] >= 300 ).all ()) # groupby filtering, 남녀 모두 300개 이상이어야 하므로 .all()
      movie_id gender  mean  count   total  prop
0            1      F  4.19    591  246440  0.00
1            1      M  4.13   1486  753769  0.00
20          11      F  3.92    379  246440  0.00
21          11      M  3.72    654  753769  0.00
...        ...    ...   ...    ...     ...   ...
6451      3578      F  4.09    385  246440  0.00
6452      3578      M  4.11   1539  753769  0.00
6773      3751      F  3.89    367  246440  0.00
6774      3751      M  3.88    962  753769  0.00

[262 rows x 6 columns]
# 또는 = ('count >= 300' )"movie_id" )filter (lambda x: x.shape[0 ] == 2 ) # df.shape: (row 개수, col 개수) 6 )
    movie_id gender  mean  count   total  prop
0          1      F  4.19    591  246440  0.00
1          1      M  4.13   1486  753769  0.00
20        11      F  3.92    379  246440  0.00
21        11      M  3.72    654  753769  0.00
32        17      F  4.23    420  246440  0.00
33        17      M  3.82    415  753769  0.00
5.2 이 데이터를 popular_movies라고 명명하고,gender에 관해 wide format으로 변환한 후; pivot()을 이용assign()을 이용
= (= "movie_id" , columns= "gender" , values= "mean" )= lambda x: x.F - x.M)"diffs" )
gender      F    M  diffs
movie_id
2791     3.66 4.06  -0.41
1221     4.04 4.44  -0.40
589      3.79 4.12  -0.33
1214     3.89 4.22  -0.33
...       ...  ...    ...
17       4.23 3.82   0.41
920      4.27 3.83   0.44
1028     4.20 3.73   0.47
2657     3.67 3.16   0.51

[131 rows x 3 columns]
5.3 여자의 선호가 더 큰 영화 5편과 남자의 선호가 더 큰 영화 5편 (선호 차이의 크기 순서로)을 구해보세요. 이를 위해서 movies 테이블에서 영화제목을 merge()를 이용해 구하세요.
= diffs_fm.merge("movie_id" , "title" ]], left_index= True , right_on= "movie_id" # left_index: index를 키로 사용할 때; diffs_fm의 movie_id가 index!
        F    M  diffs  movie_id                              title
2722 3.66 4.06  -0.41      2791                   Airplane! (1980)
1203 4.04 4.44  -0.40      1221     Godfather: Part II, The (1974)
585  3.79 4.12  -0.33       589  Terminator 2: Judgment Day (1991)
1196 3.89 4.22  -0.33      1214                       Alien (1979)
1220 3.90 4.21  -0.31      1240             Terminator, The (1984)
        F    M  diffs  movie_id                                  title
1171 4.17 3.77   0.41      1188               Strictly Ballroom (1992)
16   4.23 3.82   0.41        17           Sense and Sensibility (1995)
908  4.27 3.83   0.44       920              Gone with the Wind (1939)
1015 4.20 3.73   0.47      1028                    Mary Poppins (1964)
2588 3.67 3.16   0.51      2657  Rocky Horror Picture Show, The (1975)
3번에서 플랏에서 유추되듯이 평가의 개수가 영화의 완성도 혹은 인기도를 파악할 수 있는 대략적인 지표가 될 수 있습니다. 즉, 평가수가 많을 수록 평점도 높습니다. 따라서 평가 개수를 바탕으로 인기도(popularity)를 수치화 하려고 합니다.
6.1 우선, 3번 플랏에서 평가수가 같다면 여성이 더 높은 평점을 주는 것으로 보이는데, 이 현상을 다음과 같이 자세히 들여다 봅니다.
이 함수의 의미를 파악하고, 20단계 (0, 1, 2, …, 19)의 popularity가 성별을 고려하여 각 영화에 부여되었음을 이해합니다.
이제, 다음과 같이 popularity에 따라 평점이 높아지는 현상을 성별을 고려한 후 본 결과를 플랏을 통해 확인해봅니다.
def popular(g):"popularity" ] = pd.qcut(g["count" ], q= 20 , labels= False )return g= mean_ratings.groupby("gender" , group_keys= False ).apply (popular)
/var/folders/tv/fwb_421x50z8bj5v37vw680r0000gn/T/ipykernel_3161/3304174707.py:5: DeprecationWarning: DataFrameGroupBy.apply operated on the grouping columns. This behavior is deprecated, and in a future version of pandas the grouping columns will be excluded from the operation. Either pass `include_groups=False` to exclude the groupings or explicitly select the grouping columns after groupby to silence this warning.
  popularity = mean_ratings.groupby("gender", group_keys=False).apply(popular)
      movie_id gender  mean  count   total  prop  popularity
0            1      F  4.19    591  246440  0.00          19
1            1      M  4.13   1486  753769  0.00          19
2            2      F  3.28    176  246440  0.00          17
3            2      M  3.18    525  753769  0.00          17
...        ...    ...   ...    ...     ...   ...         ...
7148      3951      F  3.71     17  246440  0.00           6
7149      3951      M  4.04     23  753769  0.00           4
7150      3952      F  3.76    105  246440  0.00          15
7151      3952      M  3.79    283  753769  0.00          15

[7152 rows x 7 columns]
= "popularity" , y= "mean" , color= "gender" )= 0.01 ), so.Jitter(width= .5 ))5 ))= so.Continuous().tick(at= np.arange(20 ))) # tick: x축에 표시할 값 = (5 , 6 ))
남녀별로 평점의 편차가 큰, 즉 의견이 분분한 영화들을 구해봅니다.
5번에서 구한 popular_movies에 한해 남녀별 평점의 편차를 표준편차로 구해보고,
남녀별로 편차 상위 2개만 표시합니다. (동등한 순위 모두)
영화제목을 movies 데이터와 merge하여 표시합니다.
      movie_id gender  mean  count   total  prop
0            1      F  4.19    591  246440  0.00
1            1      M  4.13   1486  753769  0.00
20          11      F  3.92    379  246440  0.00
21          11      M  3.72    654  753769  0.00
...        ...    ...   ...    ...     ...   ...
6451      3578      F  4.09    385  246440  0.00
6452      3578      M  4.11   1539  753769  0.00
6773      3751      F  3.89    367  246440  0.00
6774      3751      M  3.88    962  753769  0.00

[262 rows x 6 columns]
= ("gender" , "movie_id" ])["rating" ]"std" , "count" ])
                 std  count
gender movie_id
F      1        0.87    591
       2        1.02    176
       3        1.08    136
       4        0.93     85
...              ...    ...
M      3949     0.92    224
       3950     1.12     44
       3951     1.07     23
       3952     0.90    283

[7152 rows x 2 columns]
def top(g, n= 3 ):return g.nlargest(n, "std" , keep= "all" )= ("count > 100" ) # 100개 이상의 평점을 받은 영화만 제한 "gender" ], group_keys= False )apply (top, n= 2 )
                 std  count
gender movie_id
F      2700     1.37    258
       288      1.36    114
M      1924     1.47    208
       3864     1.35    115
= "movie_id" )
  gender  std  count                                           title  \
0      F 1.37    258     South Park: Bigger, Longer and Uncut (1999)
1      F 1.36    114                     Natural Born Killers (1994)
2      M 1.47    208                  Plan 9 from Outer Space (1958)
3      M 1.35    115  Godzilla 2000 (Gojira ni-sen mireniamu) (1999)

                    genres
0         Animation|Comedy
1          Action|Thriller
2            Horror|Sci-Fi
3  Action|Adventure|Sci-Fi
이제 초점을 유저들에게 돌려, 유저들의 특성을 고려해봅니다. 일반적으로 같은 소스(사람)에서 온 데이터는 비슷한 성향을 띄는데 이를 depenency 의 문제라고 합니다. 한 가족 구성원으로부터 왔다든가 같은 학교의 학생들과 같이 구체적으로 명시하기 어렵지만 데이터 상에서 비슷한 군집을 이룹니다. 이 데이터의 경우 동일은 유저들의 특성이 존재할 수 있는데 예를 들어 후한 점수를 준다든가 같은 유저라도 어떤 장르의 영화는 매우 낮은 평점을 준다든가 하는 현상이 있을 수 있는데 이를 알아봅니다.
8.1 우선 개인별(성별로 나눠)로 몇 개정도나 평점을 주었는지 분포를 살펴봅니다.
8.2 개인별로 평점의 평균과 표준편차를 구합니다.
8.1 우선 개인별(성별로 나눠)로 몇 개정도나 평점을 주었는지 분포를 살펴봅니다.
= user_rating.groupby(["user_id" , "gender" ]).size().reset_index(name= "n" )
      user_id gender    n
0           1      F   53
1           2      M  129
2           3      M   51
3           4      M   21
...       ...    ...  ...
6036     6037      F  202
6037     6038      F   20
6038     6039      F  123
6039     6040      M  341

[6040 rows x 3 columns]
= (= "n" , color= "gender" )
8.2 유저 개인별로 평점(rating)의 평균과 표준편차, 개수를 구합니다.
= ("user_id" )["rating" ]"mean" , "std" , "count" ])
         mean  std  count
user_id
1        4.19 0.68     53
2        3.71 1.00    129
3        3.90 0.98     51
4        4.19 1.08     21
...       ...  ...    ...
6037     3.72 0.88    202
6038     3.80 1.11     20
6039     3.88 0.73    123
6040     3.58 1.18    341

[6040 rows x 3 columns]
8.3 이 세 변수의 관계를 보기 위해, 평점 개수를 10개의 구간으로 pd.cut을 이용해 discretize해서 살펴봅니다.
8.1에서 분포를 살펴보았으면, 개수를 먼저 log 스케일로 변환해서 구간으로 쪼개는 것이 유리함을 알 것입니다.
즉, 다수는 2백개 이하의 평점을 남긴 반면, 소수의 유저들 중에는 수천개의 평점을 남긴 사람도 있습니다.
10개 구간으로 discretized된 (log) count를 .facet을 이용해 다음과 같이 유저들 각자의 평점 평균과 표준편차의 관계를 살펴봅니다.
이 현상을 설명할 수 있을까요?
평균적으로 낮은 평점을 준 소위 짠 유저들이 더 비판적이고 고민끝에 평점을 준 것이라고 추측할 수 있을까요?
"lcount" ] = np.log(user_stats["count" ])"lcount_cat" ] = pd.cut(user_stats["lcount" ], 10 , labels= False )
'mean > 2 & lcount_cat < 9' ), x= "mean" , y= "std" )= .3 ))5 ))"lcount_cat" , wrap= 3 )= (15 , 12 ))
# count의 범위를 표시하기 위해 = ('mean > 2' )"lcount_cat" )["count" ].agg(["min" , "max" ])range = lambda x: list (zip (x["min" ], x["max" ])))"range" ] = range_counts["range" ].astype(str )"lcount_cat2" ] = user_stats["lcount_cat" ].map (range_counts["range" ])
'mean > 2 & lcount_cat < 9' ), x= "mean" , y= "std" )= .3 ))5 ))"lcount_cat2" , wrap= 3 )= (15 , 12 ))
'mean > 2 & lcount_cat < 9' ), x= "mean" , y= "std" )1 ), color= "lcount_cat" )
장르별로 남녀의 선호 차이를 살펴봅니다.
movies 데이터는 genres가 | 기호로 나누어 표기되어 있어서 분석을 위해서는 가공할 필요가 있는데, 다음 코드를 이용해 long format으로 바꾸세요.
= movies.copy()"genres" ] = movies_long["genres" ].str .split("|" )= movies_long.explode("genres" )
= movies_long.merge(user_rating)
         movie_id                  title     genres  user_id gender  age  \
0               1       Toy Story (1995)  Animation        1      F    1
1               1       Toy Story (1995)  Animation        6      F   50
2               1       Toy Story (1995)  Animation        8      M   25
3               1       Toy Story (1995)  Animation        9      M   25
...           ...                    ...        ...      ...    ...  ...
2101811      3952  Contender, The (2000)   Thriller     5831      M   25
2101812      3952  Contender, The (2000)   Thriller     5837      M   25
2101813      3952  Contender, The (2000)   Thriller     5927      M   35
2101814      3952  Contender, The (2000)   Thriller     5998      M   18

         occupation    zip  rating   timestamp
0                10  48067       5   978824268
1                 9  55117       4   978237008
2                12  11413       4   978233496
3                17  61614       5   978225952
...             ...    ...     ...         ...
2101811           1  92120       3   986223125
2101812           7  60607       4  1011902656
2101813          14  10003       1   979852537
2101814           4  61820       4  1001781044

[2101815 rows x 10 columns]
9.1 장르별로 평점의 개수를 간단히 플랏으로 살펴보는데 남녀 별로 따로 비율이 나오도록 해보고, 남녀 차이가 특히 많이 나는 장르를 살펴보세요.
= "genres" , color= "gender" ) # y에 genres가 나오도록! "proportion" , common_norm= False ), so.Dodge(gap= .2 )) # gap: bar 사이의 간격
9.2 이번에는 장르별로 평점의 평균 를 남녀별로 간단히 플랏으로 확인해보세요.
= "genres" , x= "rating" , color= "gender" )= (3 , 4.2 ))
9.3 위의 플랏에서 살펴본 평균 평점의 값을 직접 구해봅니다. 장르별, 남녀로 그룹핑을 하여 평균 평점을 다음과 같이 나오도록 구해보세요.
= ("genres" , "gender" ])["rating" ]
gender      genres    F    M
0           Action 3.49 3.49
1        Adventure 3.51 3.47
2        Animation 3.74 3.66
3       Children's 3.57 3.36
..             ...  ...  ...
14          Sci-Fi 3.45 3.47
15        Thriller 3.57 3.57
16             War 3.89 3.89
17         Western 3.55 3.66

[18 rows x 3 columns]
# pivot_table을 이용하면, = "genres" , columns= "gender" , values= "rating" )
gender        F    M
genres
Action     3.49 3.49
Adventure  3.51 3.47
Animation  3.74 3.66
Children's 3.57 3.36
...         ...  ...
Sci-Fi     3.45 3.47
Thriller   3.57 3.57
War        3.89 3.89
Western    3.55 3.66

[18 rows x 2 columns]
9.4 영화별 남녀의 평균 평점의 차이(Female - Male) 순으로 정렬된 플랏을 대략적으로 다음과 같이 그려봅니다.
= genre_gender_wide.assign(= lambda x: x.F - x.M"diff" )
gender      genres    F    M  diff
17         Western 3.55 3.66 -0.10
9        Film-Noir 4.02 4.09 -0.07
5            Crime 3.69 3.71 -0.02
14          Sci-Fi 3.45 3.47 -0.02
..             ...  ...  ...   ...
8          Fantasy 3.51 3.43  0.09
13         Romance 3.67 3.57  0.10
11         Musical 3.81 3.60  0.21
3       Children's 3.57 3.36  0.21

[18 rows x 4 columns]
= ("genres" , "gender" ])["rating" ]
       genres gender  rating
0      Action      F    3.49
1      Action      M    3.49
2   Adventure      F    3.51
3   Adventure      M    3.47
..        ...    ...     ...
32        War      F    3.89
33        War      M    3.89
34    Western      F    3.55
35    Western      M    3.66

[36 rows x 3 columns]
= "genres" , x= "rating" , color= "gender" )= so.Nominal(order= genre_gender_diff["genres" ].values),= (3 , 4.2 ))
# 평균과 표준편차를 error bar를 이용해 볼 수도 있음. = "rating" , y= "genres" , color= "gender" )"mean" , errorbar= "sd" ), so.Dodge())= 3 ), so.Agg("mean" ), so.Dodge())= so.Nominal(order= genre_gender_diff["genres" ].values)
장르별로 나이대에 따른 영화시청에 차이가 있는지 살펴봅니다.
10.1 우선, 위에서 western 장르가 남녀의 평점 차이가 가장 크게 나타나 남성이 선호하는 것으로 보이는데 western 장르만 따로 떼어 나이대 별로 rating에 차이가 있는지 살펴봅니다.
= movies_long_all.query('genres == "Western"' )
= "age" , y= "rating" , color= "gender" )5 ))
= western.groupby(["age" , "gender" ])["rating" ].agg(["mean" , "size" ]).reset_index()
    age gender  mean  size
0     1      F  3.60    91
1     1      M  3.57   244
2    18      F  3.24   503
3    18      M  3.52  2360
..  ...    ...   ...   ...
10   50      F  3.83   330
11   50      M  3.73  2090
12   56      F  3.77   220
13   56      M  3.80  1113

[14 rows x 4 columns]
"total" ] = western_age_gender.groupby("gender" )["size" ].transform("sum" )
= western_age_gender.assign(= lambda x: x["size" ] / x["total" ]
    age gender  mean  size  total  ratio
0     1      F  3.60    91   3477   0.03
1     1      M  3.57   244  17206   0.01
2    18      F  3.24   503   3477   0.14
3    18      M  3.52  2360  17206   0.14
..  ...    ...   ...   ...    ...    ...
10   50      F  3.83   330   3477   0.09
11   50      M  3.73  2090  17206   0.12
12   56      F  3.77   220   3477   0.06
13   56      M  3.80  1113  17206   0.06

[14 rows x 6 columns]
= "age" , y= "mean" , pointsize= "ratio" , color= "gender" )= (5 , 25 ))= so.Continuous().tick(at= [1 , 18 , 25 , 35 , 45 , 50 , 56 ]))
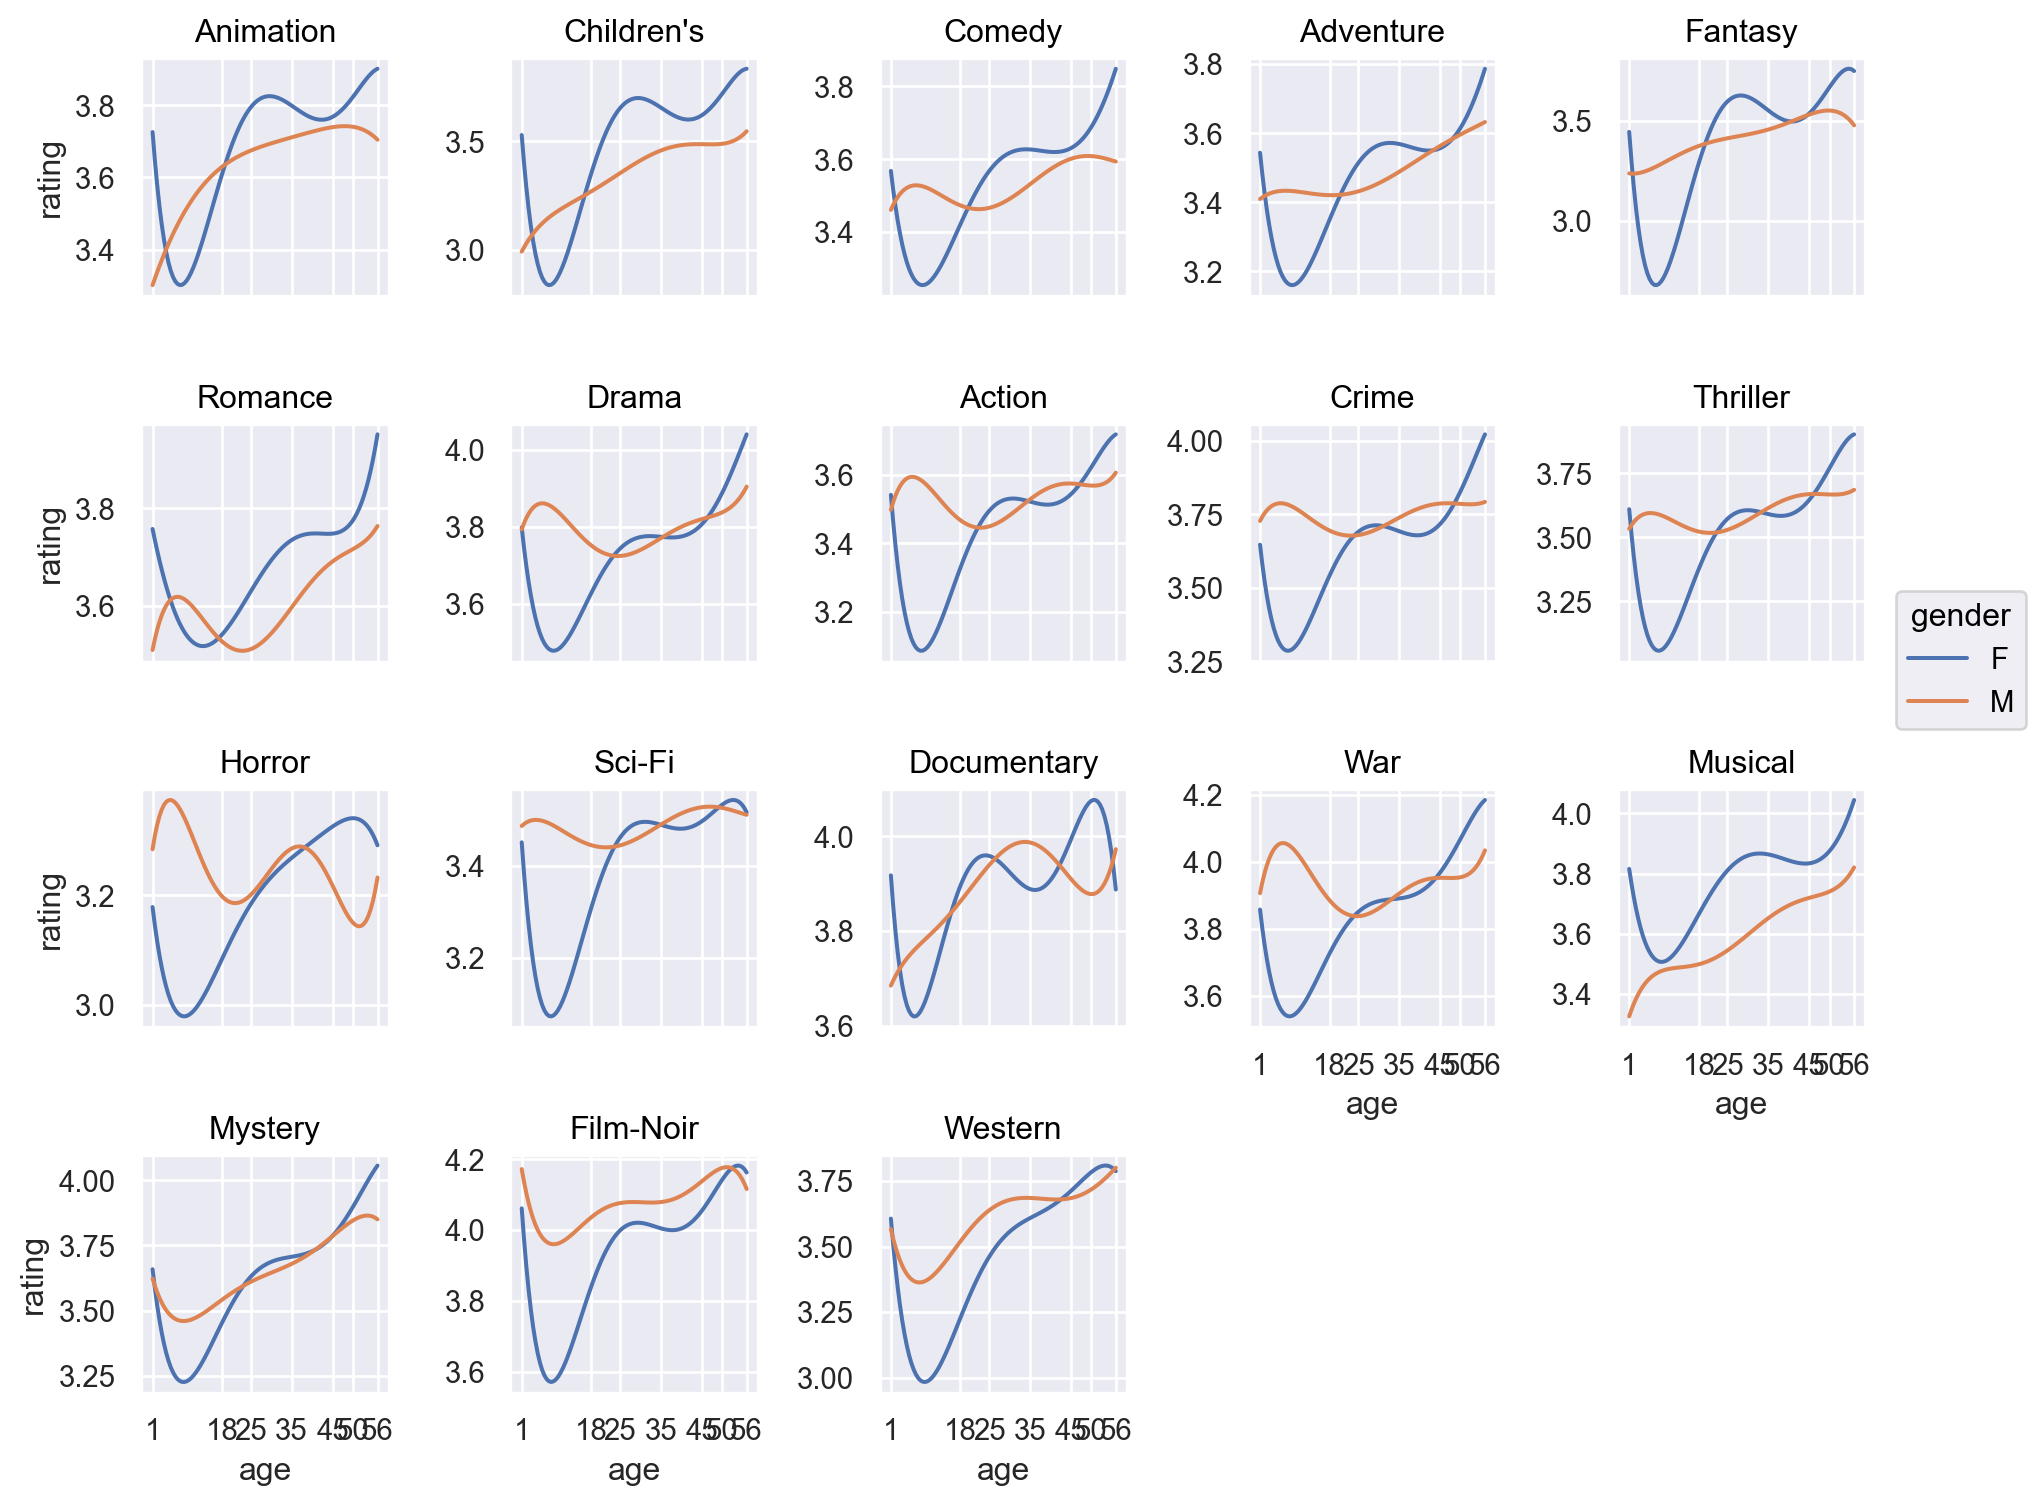
= "age" , y= "rating" , color= "gender" )5 ))"genres" , wrap= 5 )= False )= (10 , 8 ))= so.Continuous().tick(at= [1 , 18 , 25 , 35 , 45 , 50 , 56 ]))
# 평균 선으로 표시 = "age" , y= "rating" , color= "gender" )= "." ), so.Agg())"genres" , wrap= 5 )= False )= (10 , 8 ))= so.Continuous().tick(at= [1 , 18 , 25 , 35 , 45 , 50 , 56 ]))
영화 제목에 있는 출시년도를 추출해 이용하기 위해 다음 코드를 활용하세요.
"year" ] = movies["title" ].str .extract(r'\((\d {4} )\)' ).astype("int" )
      movie_id                       title                        genres  year
0            1            Toy Story (1995)   Animation|Children's|Comedy  1995
1            2              Jumanji (1995)  Adventure|Children's|Fantasy  1995
2            3     Grumpier Old Men (1995)                Comedy|Romance  1995
3            4    Waiting to Exhale (1995)                  Comedy|Drama  1995
...        ...                         ...                           ...   ...
3879      3949  Requiem for a Dream (2000)                         Drama  2000
3880      3950            Tigerland (2000)                         Drama  2000
3881      3951     Two Family House (2000)                         Drama  2000
3882      3952       Contender, The (2000)                Drama|Thriller  2000

[3883 rows x 4 columns]
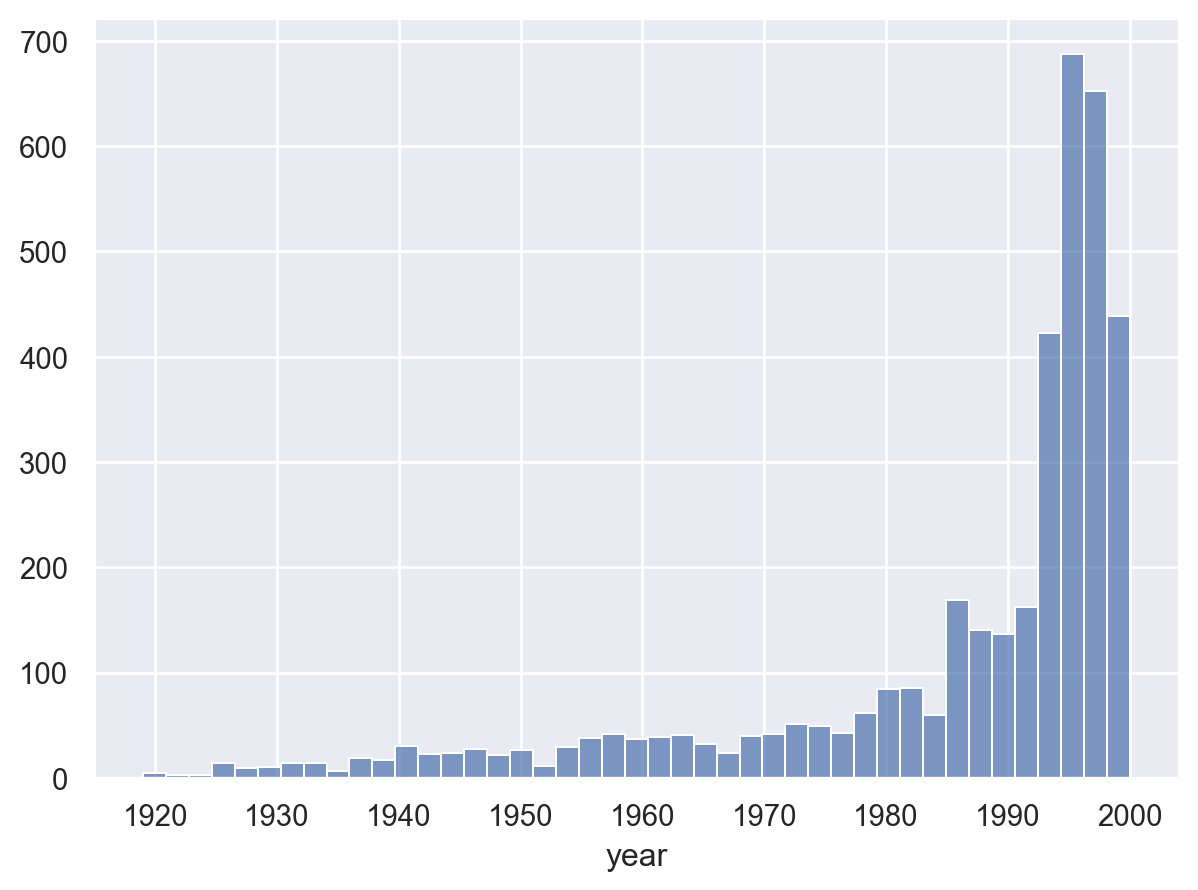
11.1 먼저 출시년도별로 얼마나 영화가 있는지 분포를 살펴보세요.
= "year" )
11.2 출시년도가 없는 영화가 있는가요?
= False )
year
1996    345
1995    342
1998    337
1997    315
       ...
1919      3
1922      2
1920      2
1921      1
Name: count, Length: 81, dtype: int64
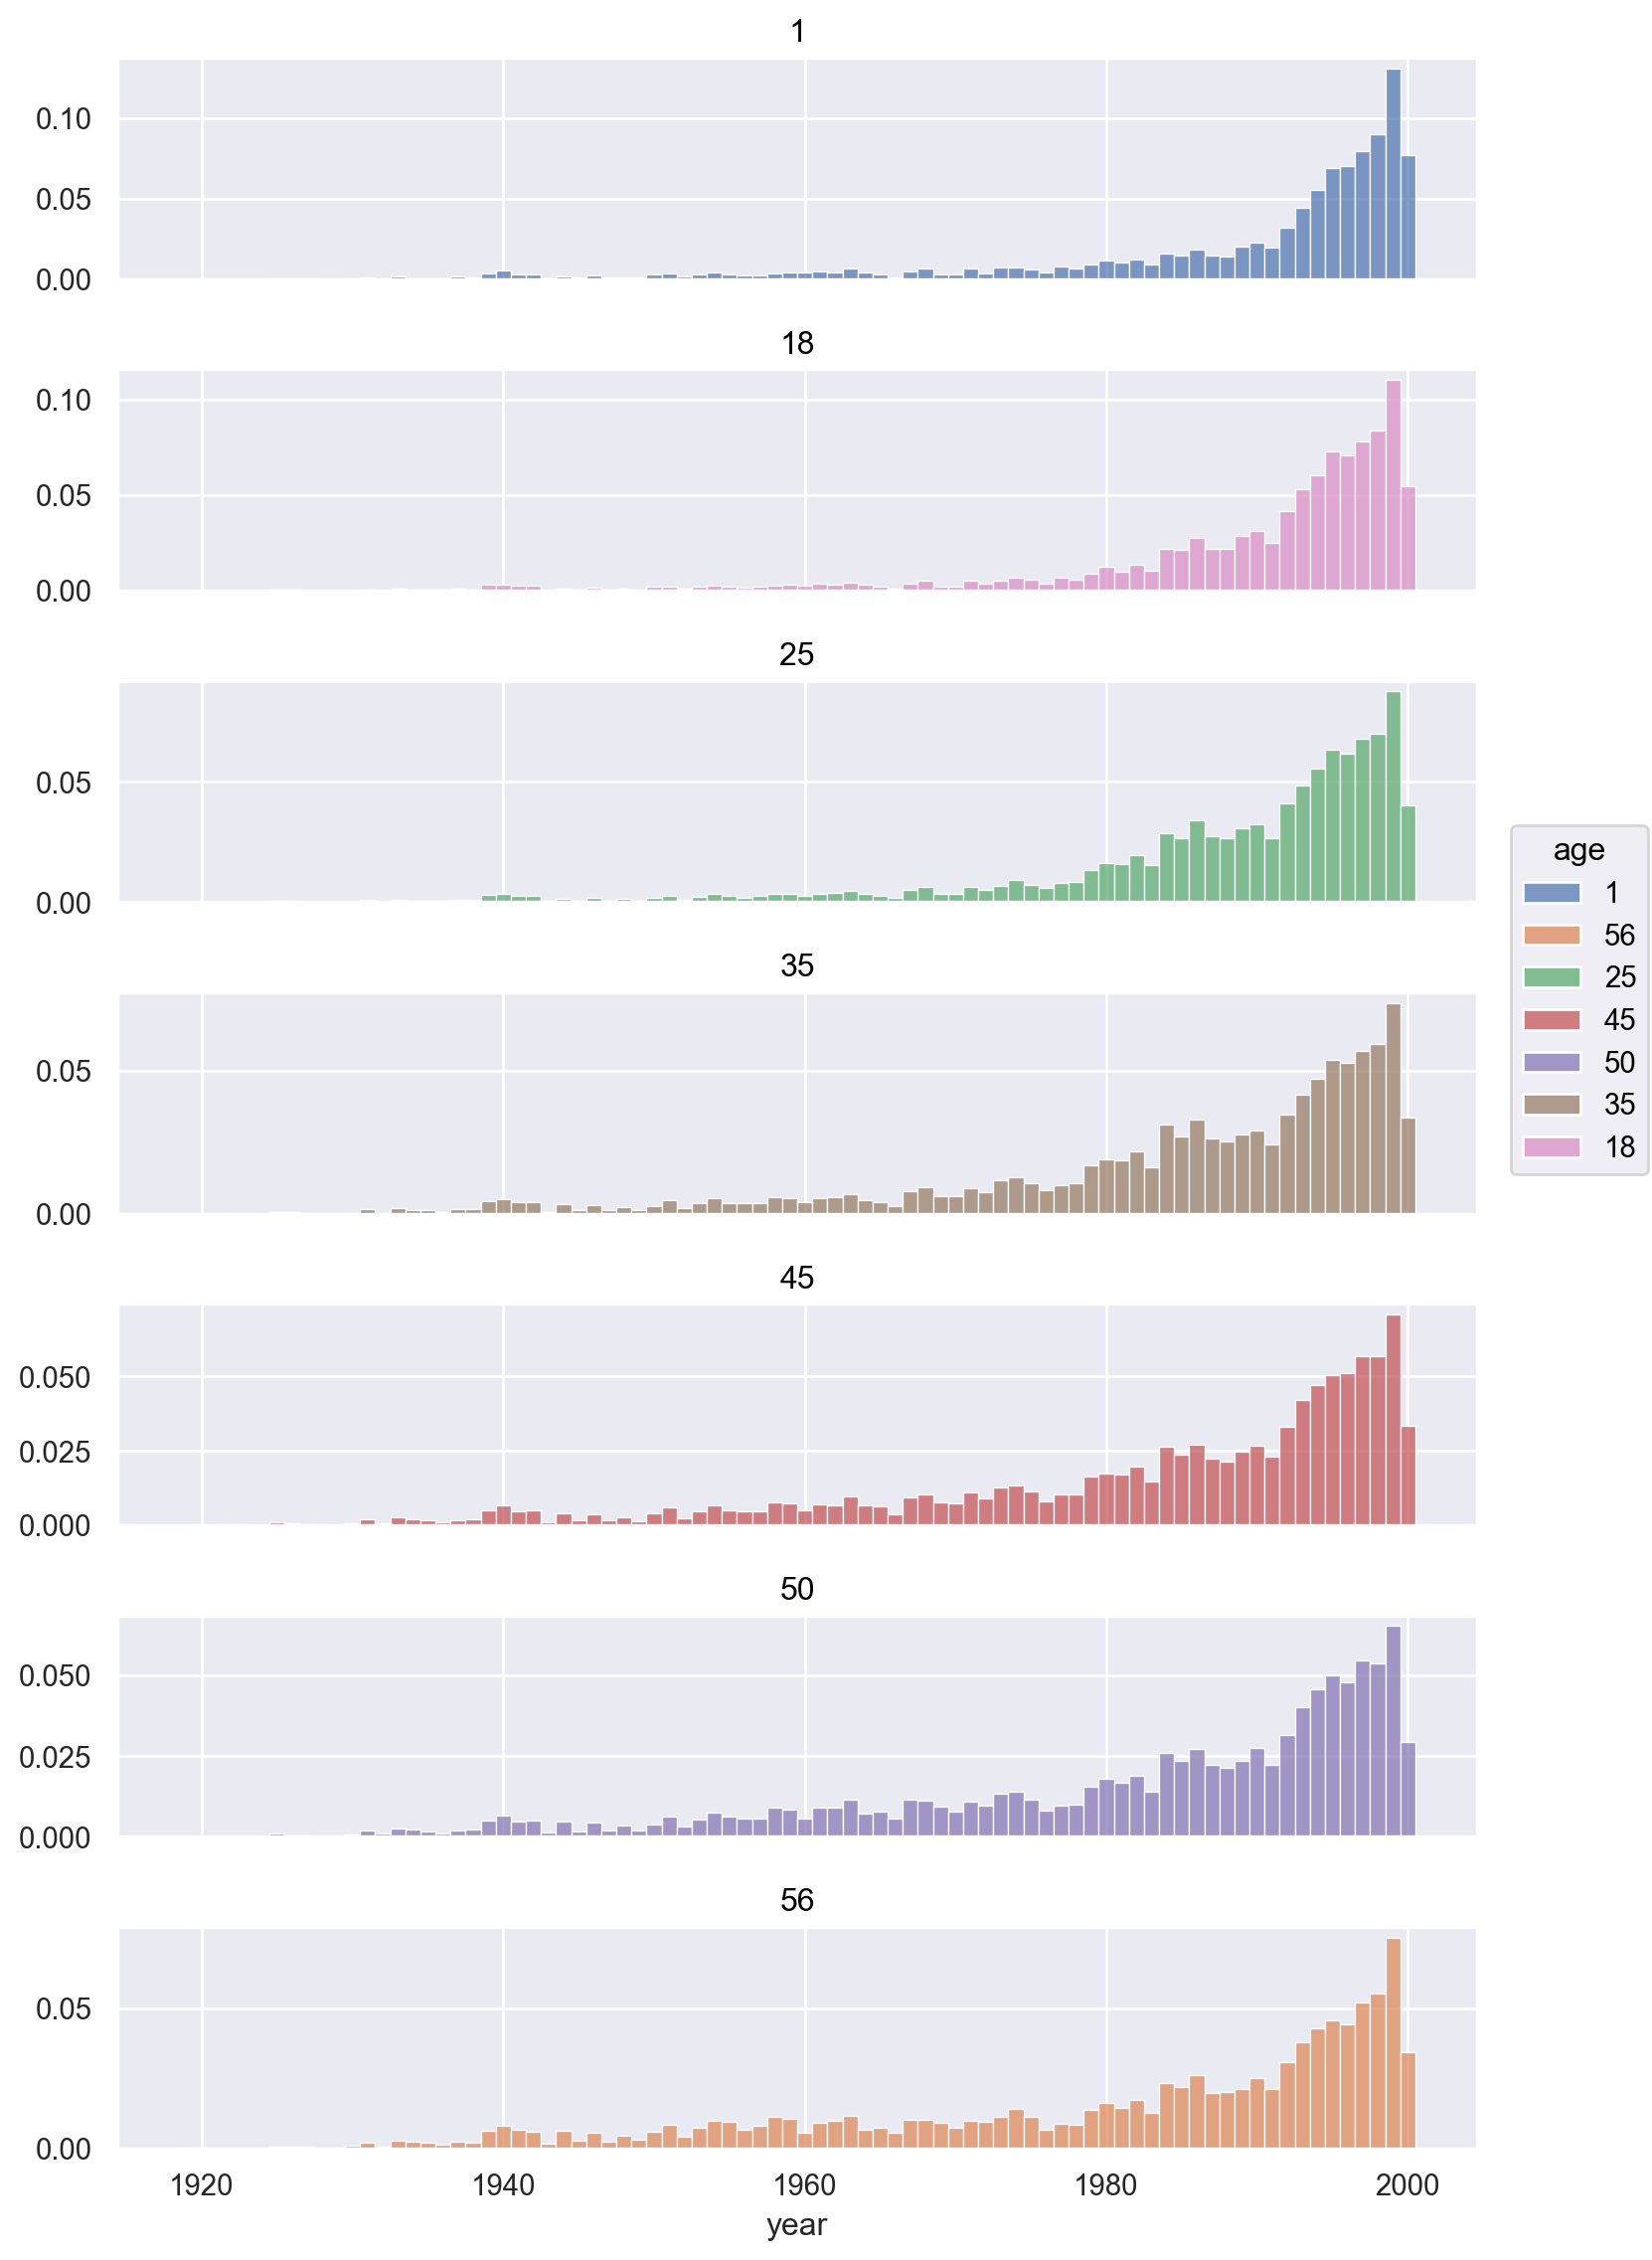
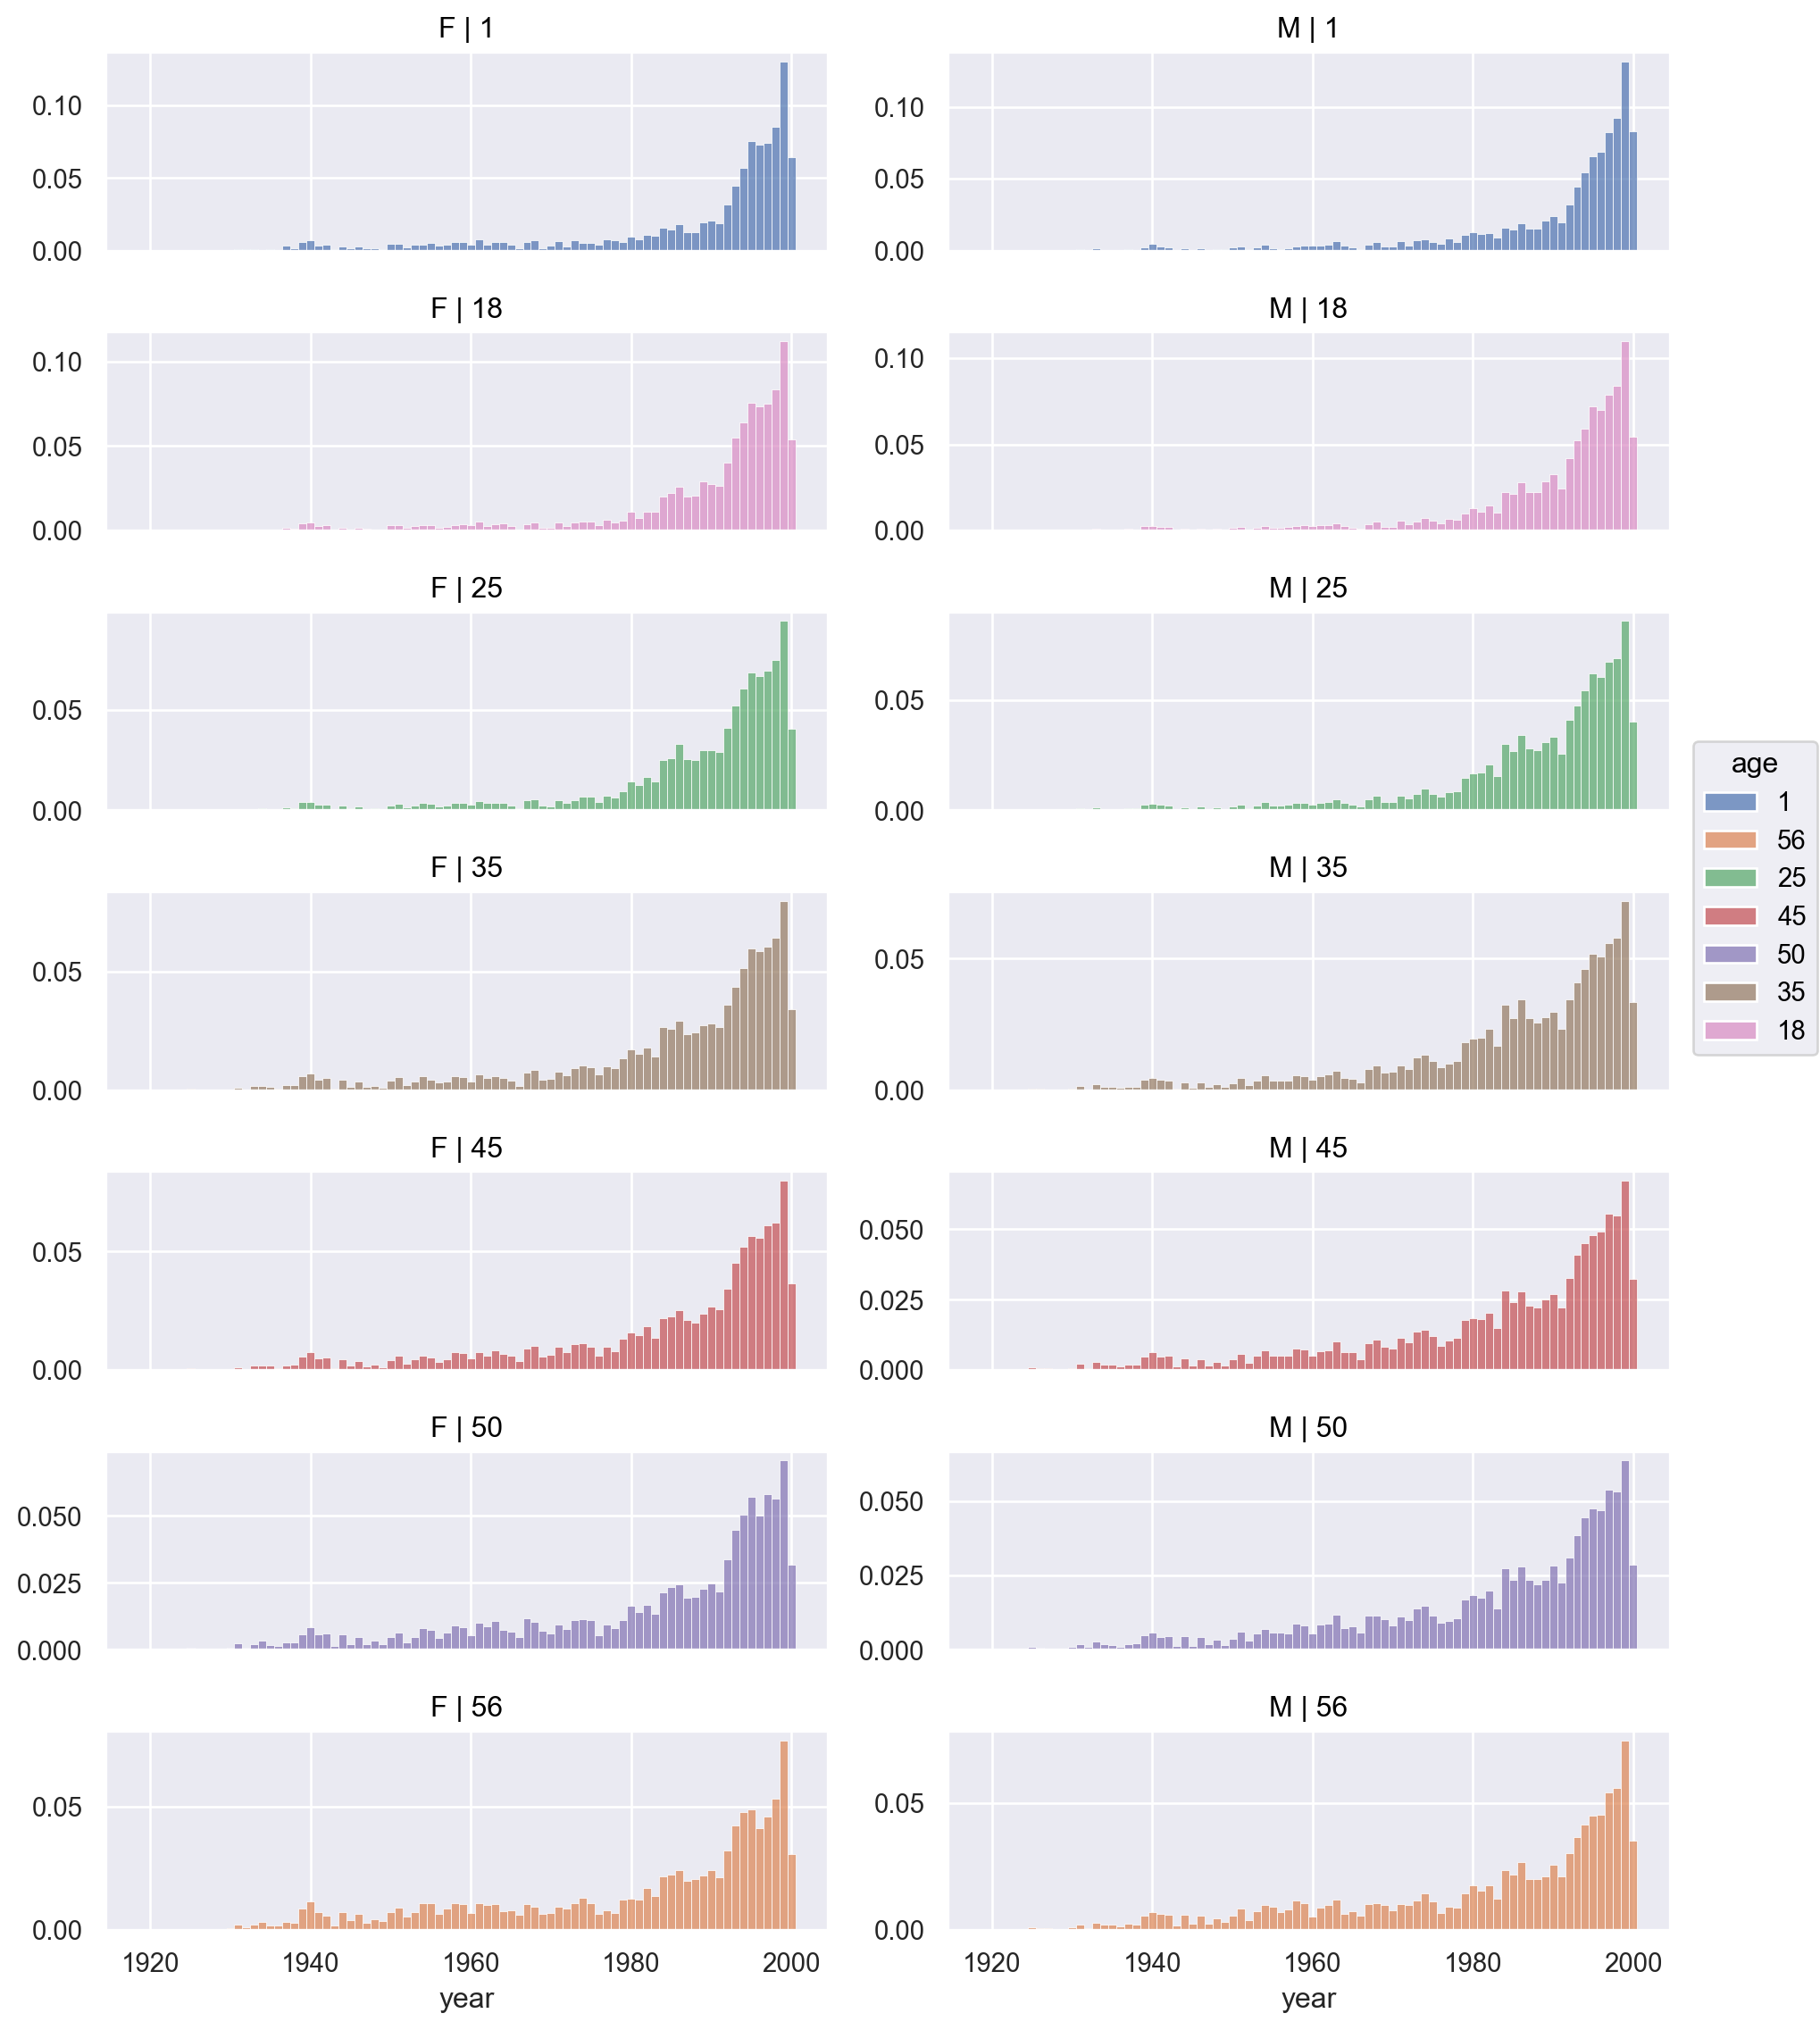
11.3 오래된 영화일 수록 나이든 사람들의 시청 비율이 높을지에 대해 분포를 살펴보세요.
= pd.merge(user_rating[["user_id" , "gender" , "age" , "movie_id" , "rating" ]], movies)3 )
   user_id gender  age  movie_id  rating  \
0        1      F    1      1193       5
1        1      F    1       661       3
2        1      F    1       914       3

                                    title                        genres  year
0  One Flew Over the Cuckoo's Nest (1975)                         Drama  1975
1        James and the Giant Peach (1996)  Animation|Children's|Musical  1996
2                     My Fair Lady (1964)               Musical|Romance  1964
= year_movies.assign(= lambda x: pd.Categorical(x.age.astype("string" ), categories= ["1" , "18" , "25" , "35" , "45" , "50" , "56" ], ordered= True )
= "year" , color= "age" )"proportion" , common_norm= False , discrete= True ))= False )"age" , wrap= 1 )= (8 , 12 ))
# 성별에 따라서도 나누어 보면, = "year" , color= "age" )"proportion" , common_norm= ["color" , "col" ], discrete= True ))= False )= "age" , col= "gender" )= (10 , 12 ))
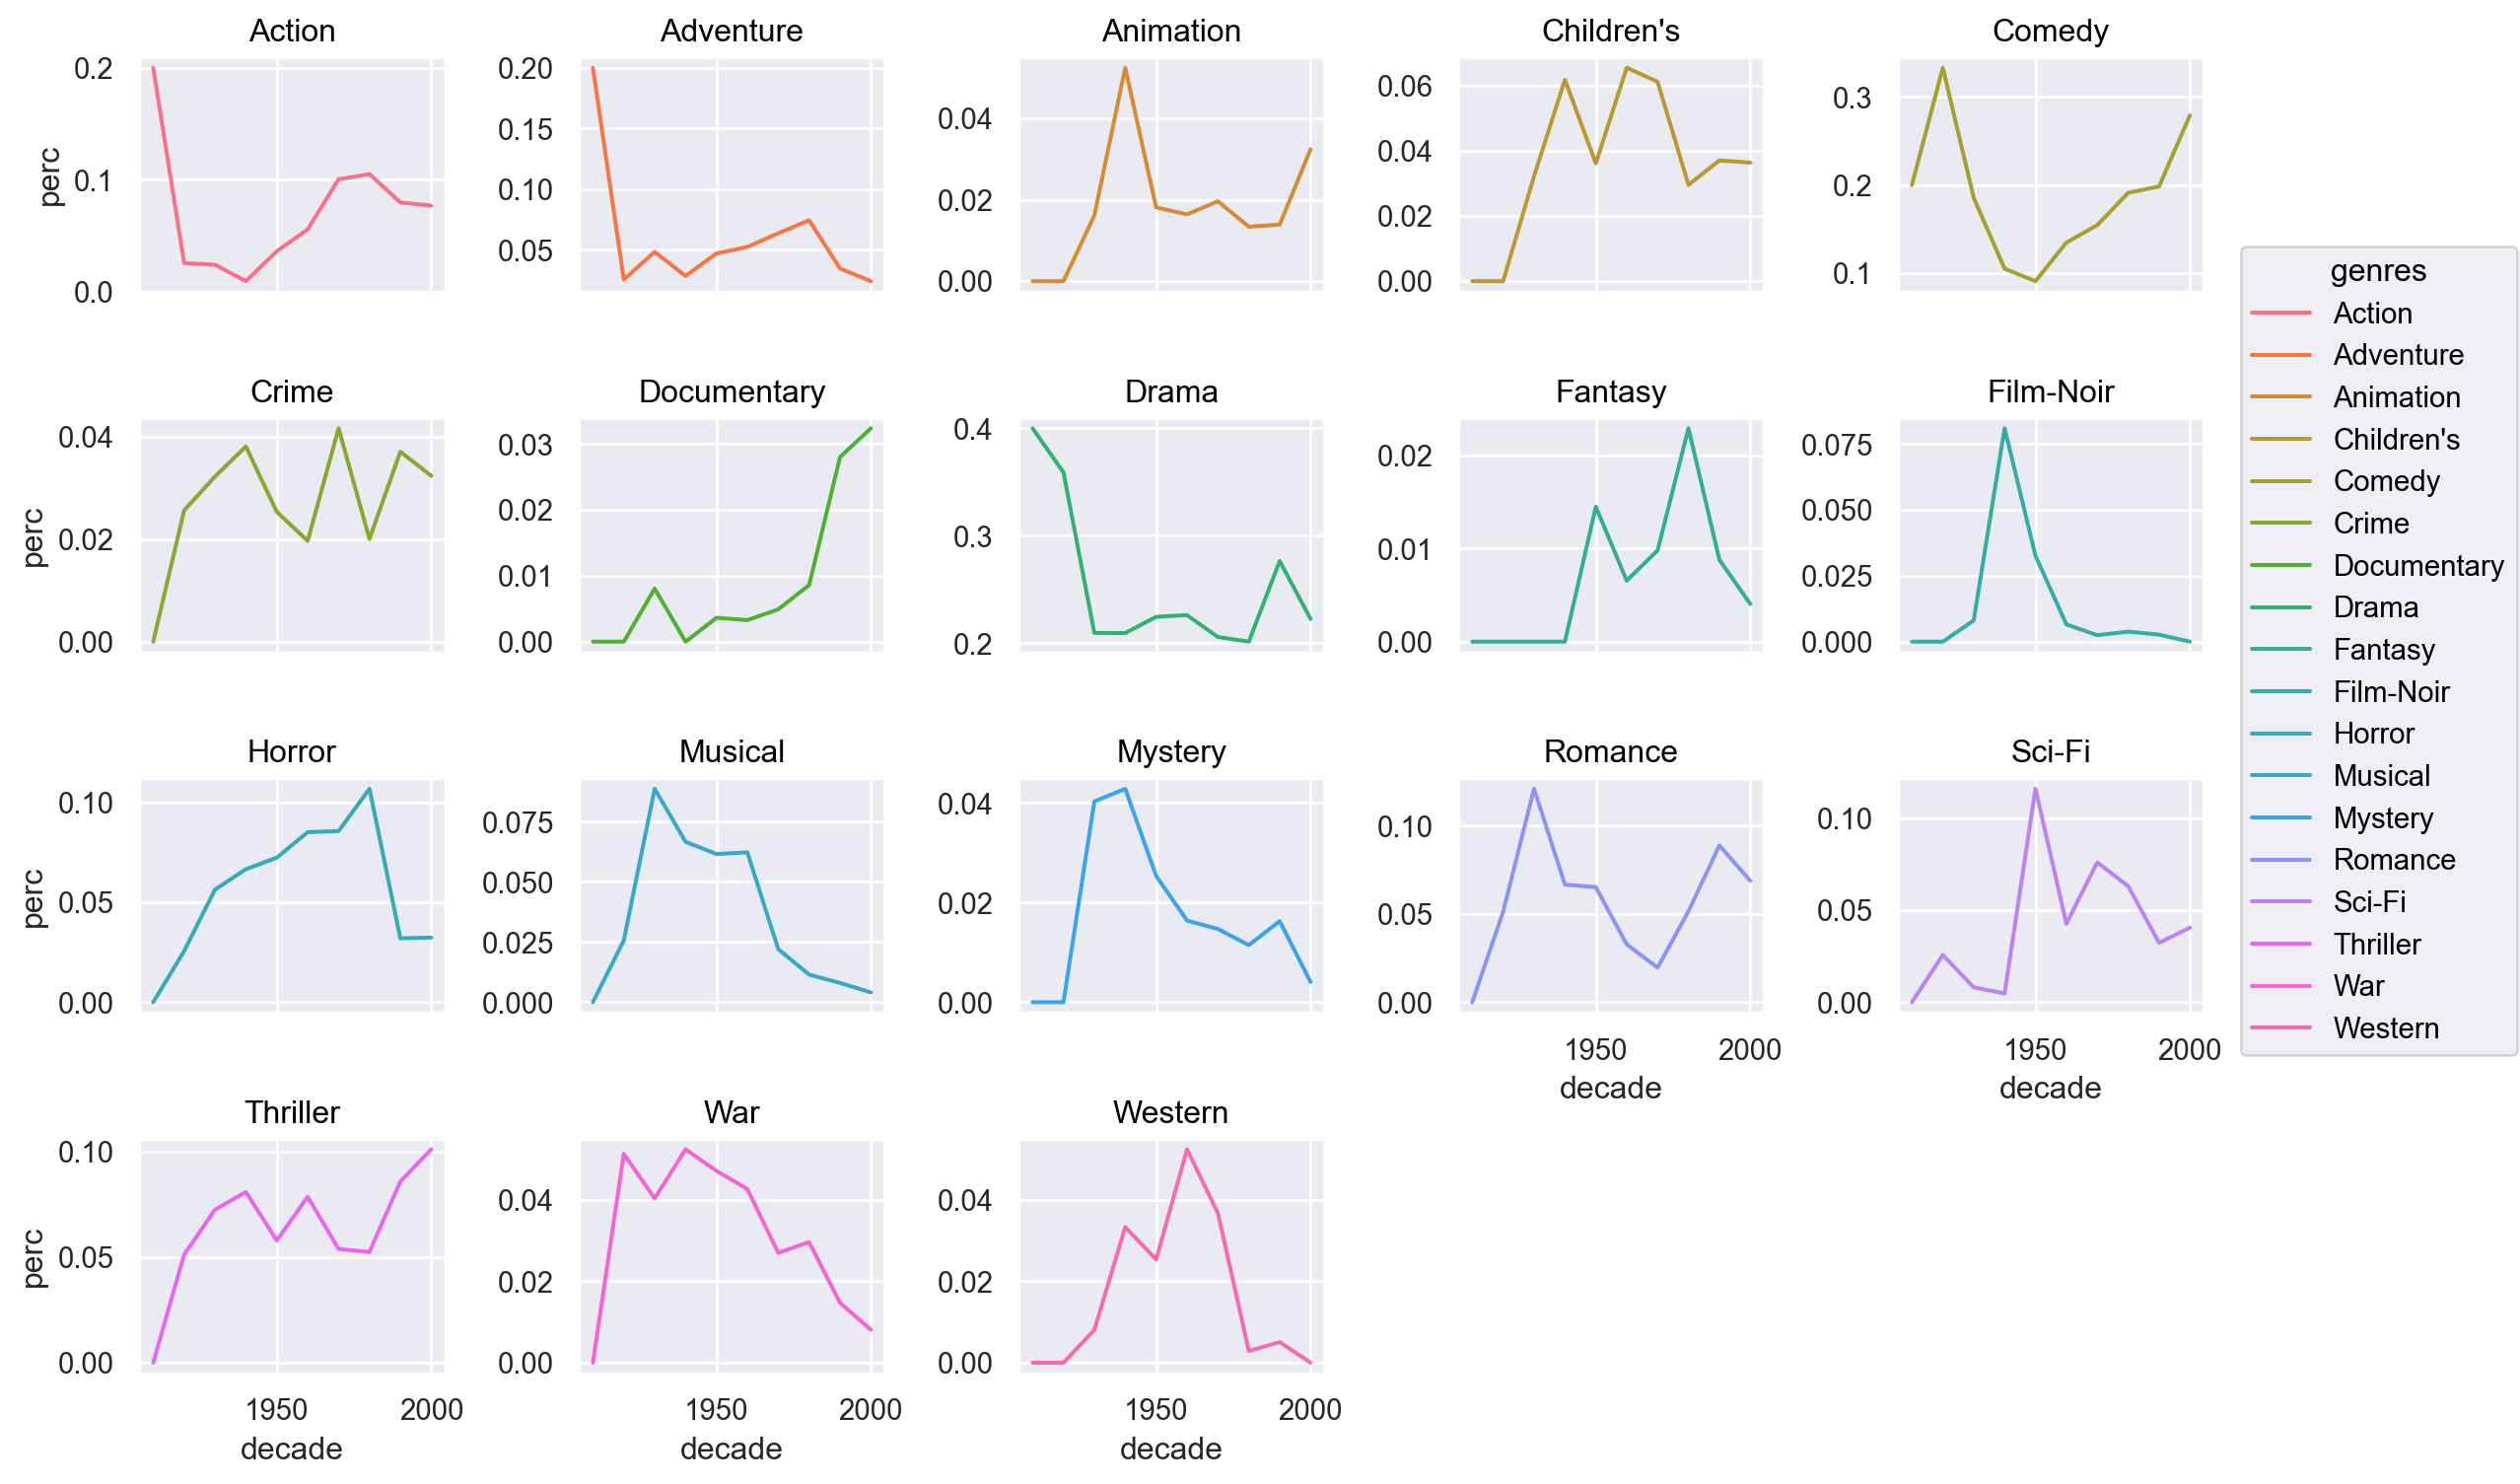
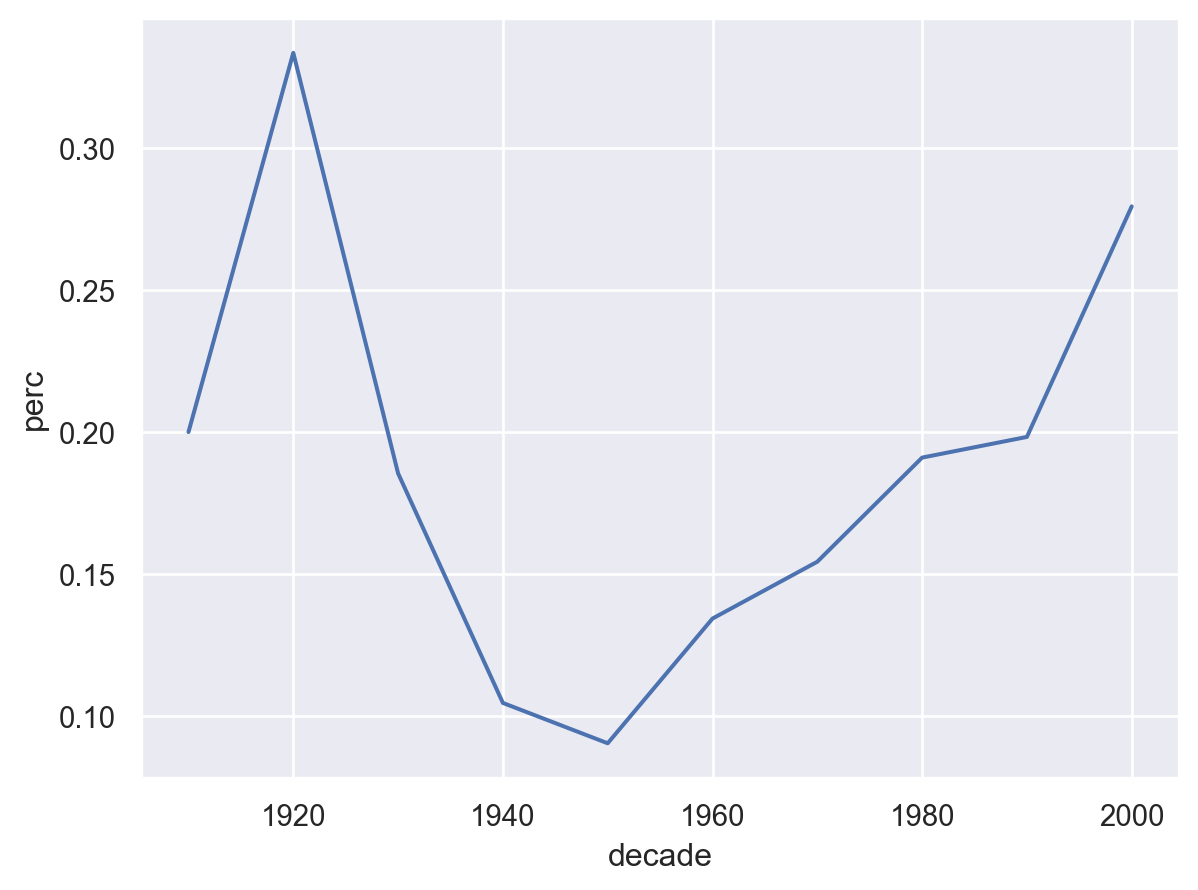
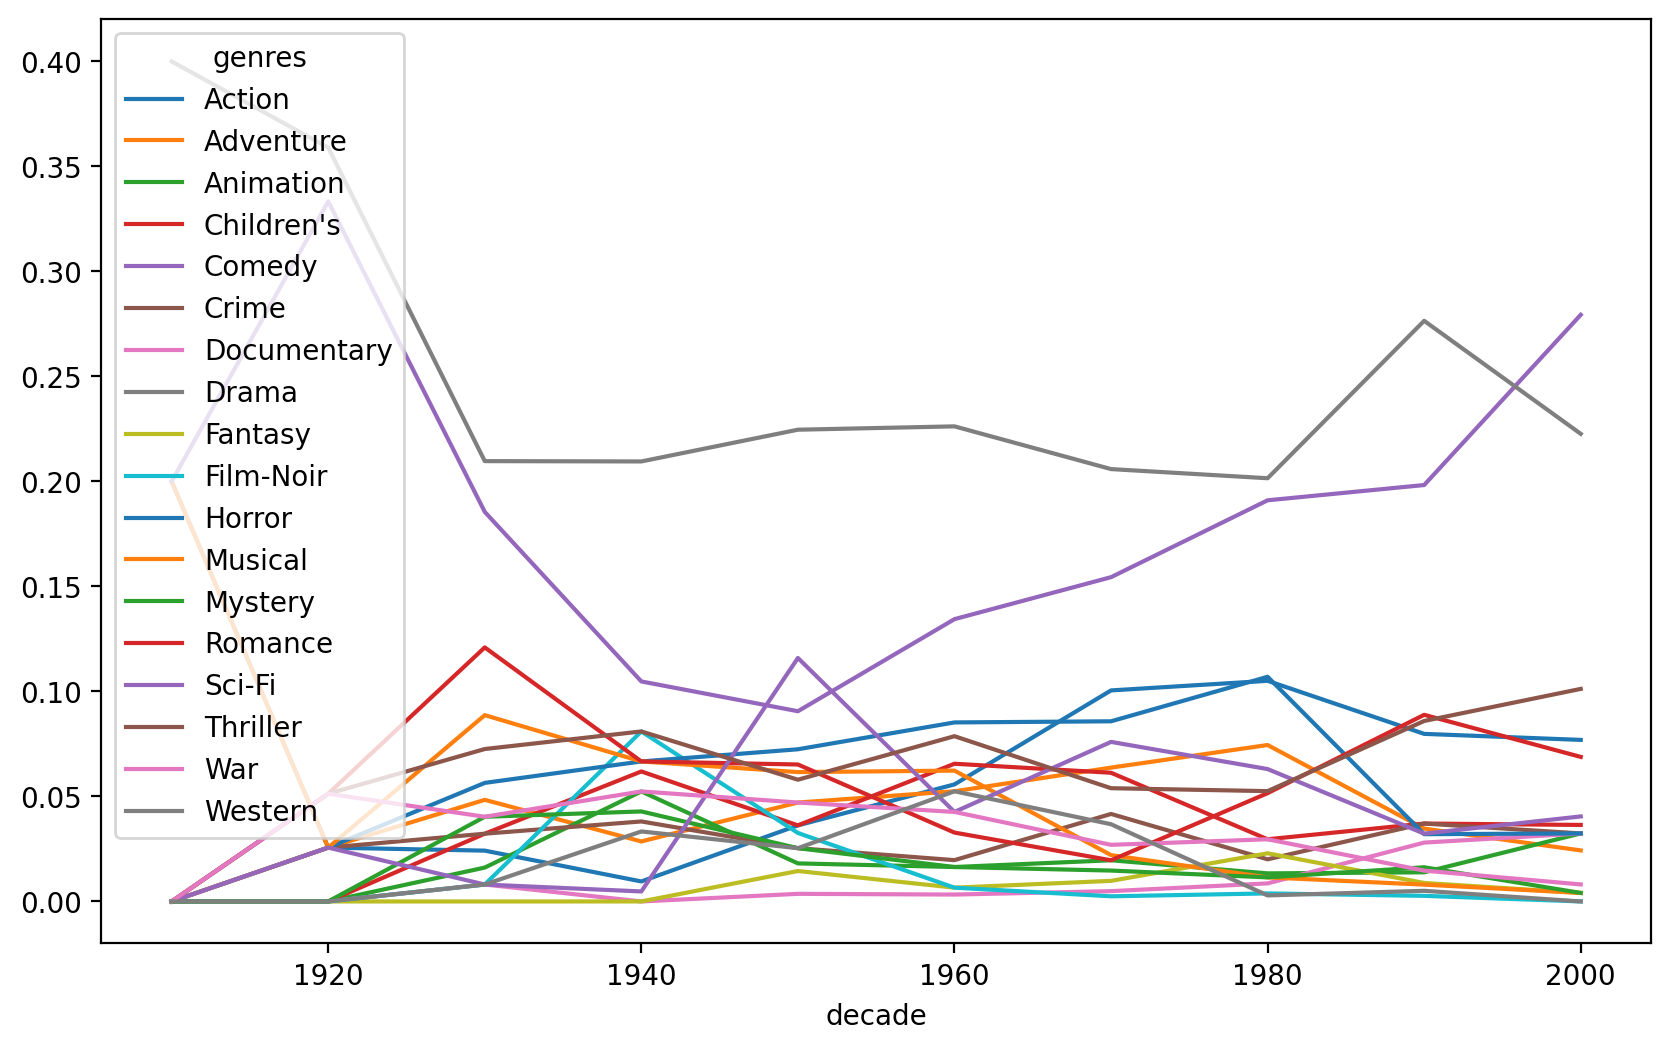
10년 기준으로 년대를 정했을 때, 코미디 장르의 영화 비율의 년대별 변화를 살펴봅니다.
"year" ] = movies_long["title" ].str .extract(r'\((\d {4} )\)' ).astype("int" )= movies_long.assign(= lambda x: x.year // 10 * 10
      movie_id                    title      genres  year  decade
0            1         Toy Story (1995)   Animation  1995    1990
0            1         Toy Story (1995)  Children's  1995    1990
0            1         Toy Story (1995)      Comedy  1995    1990
1            2           Jumanji (1995)   Adventure  1995    1990
...        ...                      ...         ...   ...     ...
3880      3950         Tigerland (2000)       Drama  2000    2000
3881      3951  Two Family House (2000)       Drama  2000    2000
3882      3952    Contender, The (2000)       Drama  2000    2000
3882      3952    Contender, The (2000)    Thriller  2000    2000

[6408 rows x 5 columns]
# pd.crosstab의 비율을 이용하면, = pd.crosstab("decade" ], movies_long_10["genres" ], normalize= "index"
decade  genres
1910    Action       0.20
        Adventure    0.20
        Animation    0.00
        Children's   0.00
                     ...
2000    Sci-Fi       0.04
        Thriller     0.10
        War          0.01
        Western      0.00
Length: 180, dtype: float64
= "perc" ), x= "decade" , y= "perc" , color= "genres" )"genres" , wrap= 5 )= False )= (12 , 8 ))
= "perc" ).query('genres == "Comedy"' ), x= "decade" , y= "perc" )
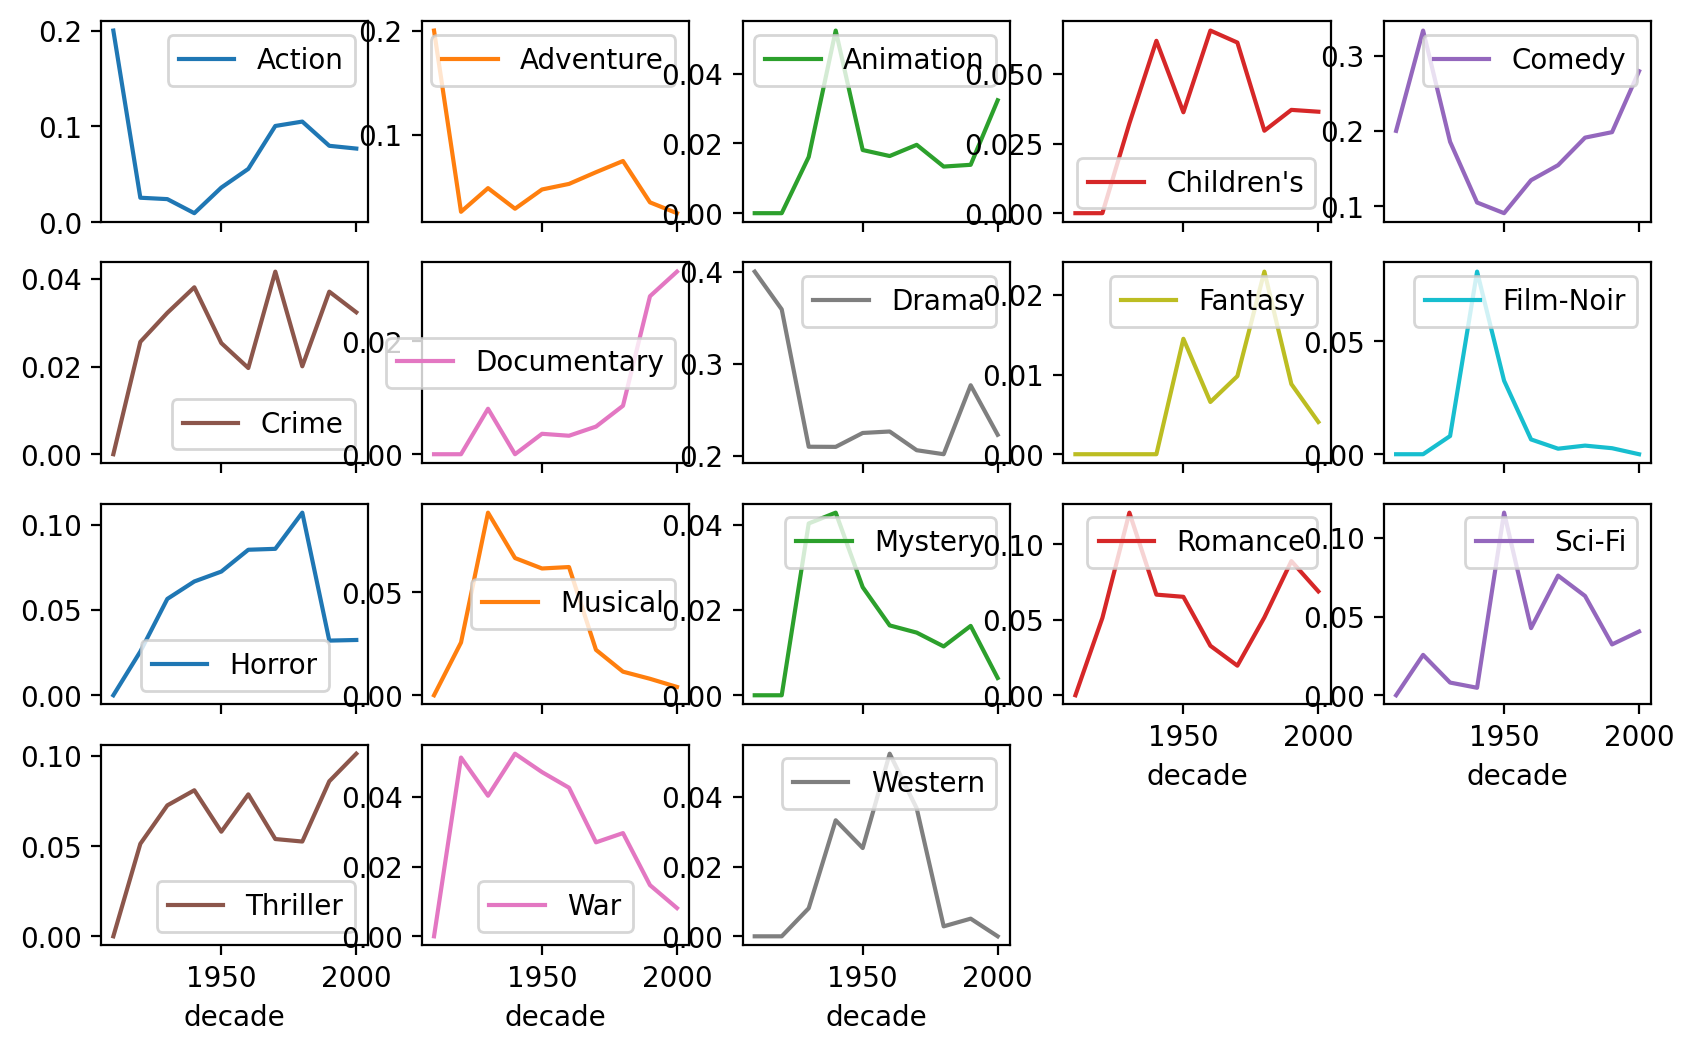
Wide format의 이용
= pd.crosstab("decade" ], movies_long_10["genres" ], normalize= "index" 3 )
genres  Action  Adventure  Animation  Children's  Comedy  Crime  Documentary  \
decade
1910      0.20       0.20       0.00        0.00    0.20   0.00         0.00
1920      0.03       0.03       0.00        0.00    0.33   0.03         0.00
1930      0.02       0.05       0.02        0.03    0.19   0.03         0.01

genres  Drama  Fantasy  Film-Noir  Horror  Musical  Mystery  Romance  Sci-Fi  \
decade
1910     0.40     0.00       0.00    0.00     0.00     0.00     0.00    0.00
1920     0.36     0.00       0.00    0.03     0.03     0.00     0.05    0.03
1930     0.21     0.00       0.01    0.06     0.09     0.04     0.12    0.01

genres  Thriller  War  Western
decade
1910        0.00 0.00     0.00
1920        0.05 0.05     0.00
1930        0.07 0.04     0.01
# Plot using pandas or matplotlib = "line" ,figsize= (10 , 6 ), subplots= True , layout= (4 , 5 ));
# Plot using pandas or matplotlib = "line" ,figsize= (10 , 6 ), layout= (4 , 5 ));
