Load packages
# numerical calculation & data frames import numpy as npimport pandas as pd# visualization import matplotlib.pyplot as pltimport seaborn as snsimport seaborn.objects as so# statistics import statsmodels.api as sm# pandas options 'mode.copy_on_write' , True ) # pandas 2.0 = ' {:.2f} ' .format # pd.reset_option('display.float_format') = 7 # max number of rows to display # NumPy options = 2 , suppress= True ) # suppress scientific notation # For high resolution display import matplotlib_inline"retina" )
R for Data Science
Visualising, transforming, modelling을 통해 질문들을 개선하거나 새로운 질문들을 생성 하면서 데이터에 대한 이해를 늘리면서 질문들에 답을 구하는 반복순환 과정
크게 다음 2가지 타입의 질문을 기본으로 시작
각 변수들 내에 변동성 (variation) 은 어떠한가?
두 변수들간에 공변성 (covariation) 은 어떠한가?
# import a dataset = sm.datasets.get_rdataset("diamonds" , "ggplot2" )= diamonds_data.data
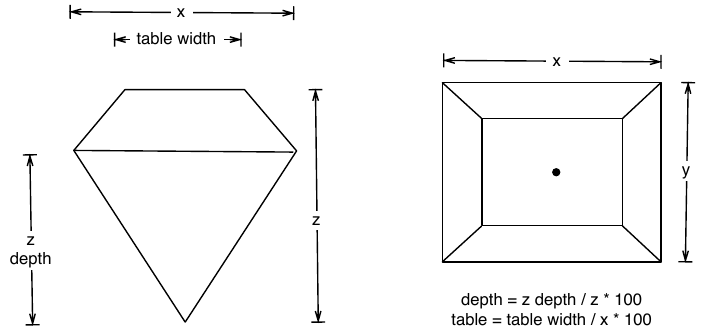
print (diamonds_data.__doc__)
       carat        cut color clarity  depth  table  price    x    y    z
0       0.23      Ideal     E     SI2  61.50  55.00    326 3.95 3.98 2.43
1       0.21    Premium     E     SI1  59.80  61.00    326 3.89 3.84 2.31
2       0.23       Good     E     VS1  56.90  65.00    327 4.05 4.07 2.31
...      ...        ...   ...     ...    ...    ...    ...  ...  ...  ...
53937   0.70  Very Good     D     SI1  62.80  60.00   2757 5.66 5.68 3.56
53938   0.86    Premium     H     SI2  61.00  58.00   2757 6.15 6.12 3.74
53939   0.75      Ideal     D     SI2  62.20  55.00   2757 5.83 5.87 3.64

[53940 rows x 10 columns]
# cut, color, clarity 모두 Categorical type으로 변형 "cut" ] = pd.Categorical("cut" ], = ["Fair" , "Good" , "Very Good" , "Premium" , "Ideal" ],= True "color" ] = pd.Categorical("color" ], = ["D" , "E" , "F" , "G" , "H" , "I" , "J" ],= True "clarity" ] = pd.Categorical("clarity" ], = ["I1" , "SI2" , "SI1" , "VS2" , "VS1" , "VVS2" , "VVS1" , "IF" ],= True
Variation (변동성, 변량, 분산도)
variability, variance
대상들을 측정함 따라 값이 변화하는 경향성
변수는 고유한 변동성의 패턴을 지니고, 흥미로운 정보를 지닐 수 있음.
이를 살펴보는 최선의 방식은 분포를 살펴보는 것임
호기심에 따라 다양한 질문이나 의심을 품게 되면서 탐색을 진행.
먼저 diamonds 데이터에서 54,000개 정도되는 다이아몬드의 무게(캐럿, carat)의 분포를 다이어그램으로 살펴보는 것으로 시작하면,
= "carat" )= .5 ))
# Zoom-in = "carat" )= .01 ))= (0 , 50 ))
전형적인 값들
어떤 값들이 가장 흔하게 나오며, 왜 그런가?
어떤 값들이 가장 드물며, 왜 그런가?
어떤 특이한 패턴들이 있다면, 왜 그런가?
극단값들을 제거하고 확대해서 살펴보면
'carat < 3' ), x= "carat" )= .01 ))
= 0 "carat" ).head(15 )
carat
0.30    2604
0.31    2249
1.01    2242
0.70    1981
0.32    1840
1.00    1558
0.90    1485
0.41    1382
0.40    1299
0.71    1294
0.50    1258
0.33    1189
0.51    1127
0.34     910
1.02     883
dtype: int64
다음과 같은 질문들을 해볼 수 있음
왜 특정 캐럿의 다이아몬드가 더 많은가?
왜 피크의 오른쪽으로 더 많은 다이아몬드가 있는가?
왜 3캐럿 이상은 거의 없는가?
군집을 이루는 패턴에 대해서는,
각 군집 안에서는 측정값들은 서로 비슷한 면이 있는가?
다른 군집 간에 측정값들는 서로 어떻게 다른가?
군집들이 어떻게 만들어진 것인지, 혹은 그 이유는 무엇인가?
군집의 모양에 현혹되어 왜 잘못된 분석으로 이끌 수 있는가?
위의 질문들은 변수들간의 관계를 탐색하도록 이끌며, 이는 다음 공변량(covariation)에서 다룰 것임.
특이한 값들
이상치(outliers)는 전형적인 패턴에서 벗어난 값들
입력 오류일 수도..
새로운 발견의 단초를 제공해 줄 수도…
이상치들을 제거하고 분석해보고
그 결과에 영향을 거의 주지 않고, 이상치가 왜 있는지 알 수 없을 경우: 결측치(NA)로 대체해도 좋음
그렇지 않다면, 이상치가 왜 생겼는지 조사하거나, 제거한 경우에는 결과에서 보고해야 함
Diamonds 치수(x, y, z) 중 y(width in mm)값
= so.Plot(diamonds, x= "y" ).add(so.Bars(), so.Hist(binwidth= .5 ))= so.Plot(diamonds, x= "y" ).add(so.Bars(), so.Hist(binwidth= .5 )).limit(y= (0 , 30 ))
= 0 = ("price" , "x" , "y" , "z" ]]'y < 3 | y > 20' )"y" )
       price    x     y    z
11963   5139 0.00  0.00 0.00
15951   6381 0.00  0.00 0.00
24520  12800 0.00  0.00 0.00
26243  15686 0.00  0.00 0.00
27429  18034 0.00  0.00 0.00
49556   2130 0.00  0.00 0.00
49557   2130 0.00  0.00 0.00
49189   2075 5.15 31.80 5.12
24067  12210 8.09 58.90 8.06
연습문제
Explore the distribution of each of the x, y, and z variables in diamonds. What do you learn?
Explore the distribution of price. Do you discover anything unusual or surprising? (Hint: Carefully think about the binwidth and make sure you try a wide range of values.)
How many diamonds are 0.99 carat? How many are 1 carat? What do you think is the cause of the difference?
Missing values
특이값을 missing (NA)으로 처리할 때는 신중하게…
특이한 값들이 있는 행을 다 제거하는 방식은 금물!diamonds.query('y >= 3 & y <= 20')
만약 NA로 바꾸기로 했다면, .where(), .mask()를 활용
= diamonds.assign(= lambda x: np.where((x.y < 3 ) | (x.y > 20 ), np.nan, x.y)
.mask().where()
# 조건에 맞는 값들을 NA로 바꿈 "y" ] = diamonds["y" ].mask((diamonds["y" ] < 3 ) | (diamonds["y" ] > 20 ))
# NA의 제거에 대해 경고 없음! = "x" , y= "y" )= 1 ))
결측치들을 포함한 경우와 제거한 경우를 비교해 보고자 할 때,
Covariation (공변성, 공분산도)
변수들이 어떤 관계를 맺어 함께 변하는 경향성
관계를 맺는 변수들이 categorical인지 continuous인지에 따라 시각화에 차이
공변성에 대한 정도, 즉 얼마나 강한 관계를 지니는지를 수치로 나타내는 다양한 지표들이 통계에서 개발되었음
A categorical and continuous variable
카테고리별로 분포(frequency)를 나누어 비교
frequency polygon 이나 boxplot 을 이용One dimensional scatter plot으로 겹치지 않게 그리려면, jitter를 활용
= "price" , color= "cut" )= 500 ))
# 각 cut 내에서의 분포가 cut마다 어떻게 다른가 확인 = "price" , color= "cut" )= 500 , stat= "proportion" , common_norm= False ))
= "price" , color= "cut" )= 500 , stat= "proportion" , common_norm= False ))"cut" )
Q: 왜 fair 컷의 평균 가격이 가장 높은가???
= "cut" , y= "price" , fill= False );
Use custom plots
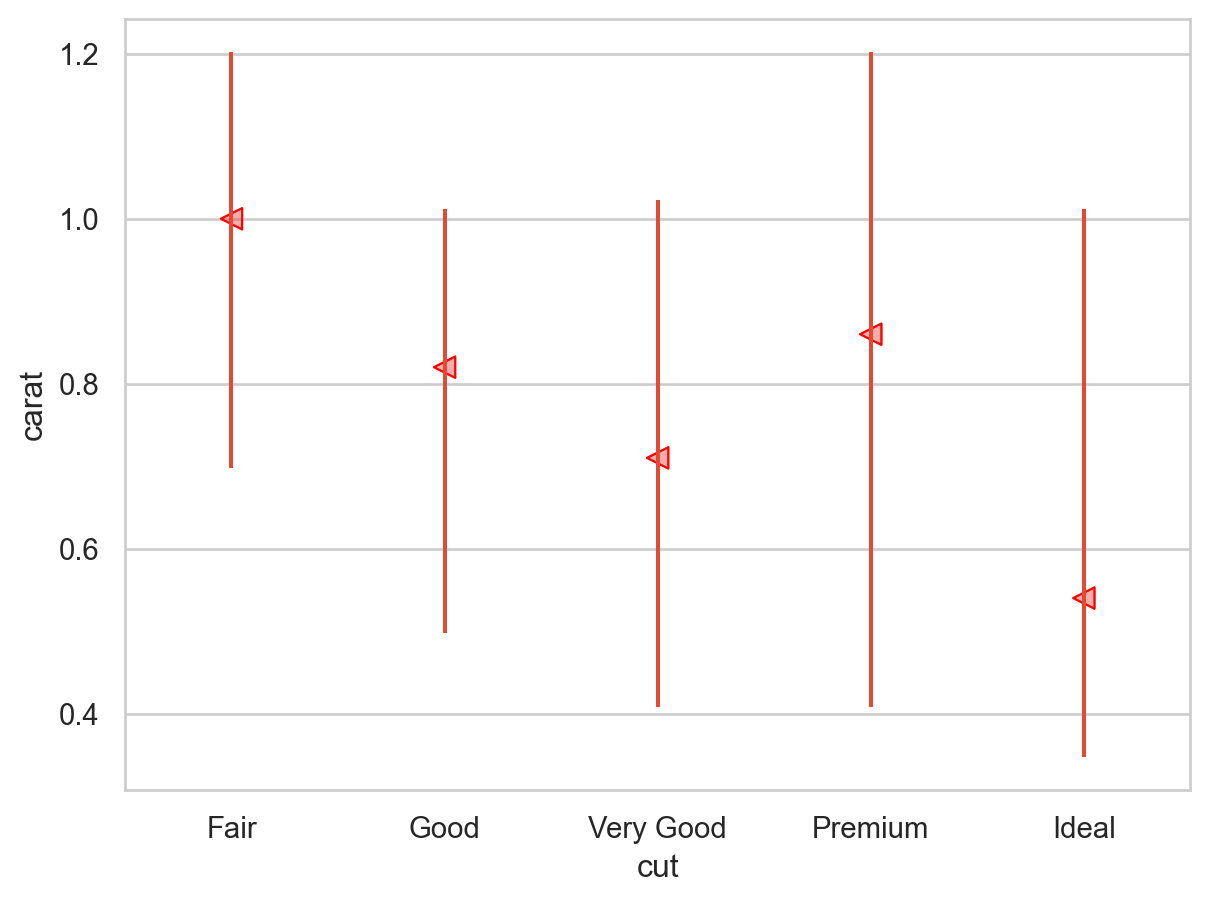
# Custom plots from sbcustom import rangeplot= "cut" , y= "price" ).layout(size= (6 , 4 ))
# Violin plot = "cut" , y= "price" , fill= False ); 다이아몬드 컷의 질이 낮을수록 평균 가격이 높은, 직관적으로 반대되는 패턴을 보임.
한편, 카테고리의 순서가 존재하지 않는 경우: 의미있는 순서로 재정렬하여 패턴 파악을 용이하게 할 수 있음
= sm.datasets.get_rdataset("mpg" , "ggplot2" ).data= mpg.groupby("class" )["hwy" ].median().sort_values().index= "class" , x= "hwy" , fill= False , order= hwy_order);
= "class" , x= "hwy" , marker= "v" )= so.Nominal(order= hwy_order))= (6 , 4 ))
연습문제
** What variable in the diamonds dataset is most important for predicting the price of a diamond? How is that variable correlated with cut? Why does the combination of those two relationships lead to lower quality diamonds being more expensive?
* Compare and contrast a violin plot with a facetted histogram, or a coloured frequency polygon. What are the pros and cons of each method?
Two categorical variables
두 범주형 변수 사이의 covariation을 파악하려면, 두 변수 값의 모든 조합에 대한 count를 표시
= diamonds.groupby(["cut" , "clarity" ]).size().reset_index(name= "n" )
      cut clarity     n
0    Fair      I1   210
1    Fair     SI2   466
2    Fair     SI1   408
..    ...     ...   ...
37  Ideal    VVS2  2606
38  Ideal    VVS1  2047
39  Ideal      IF  1212

[40 rows x 3 columns]
각 조합에 해당하는 관측값의 양에 비례하여 원의 크기를 표시하면,
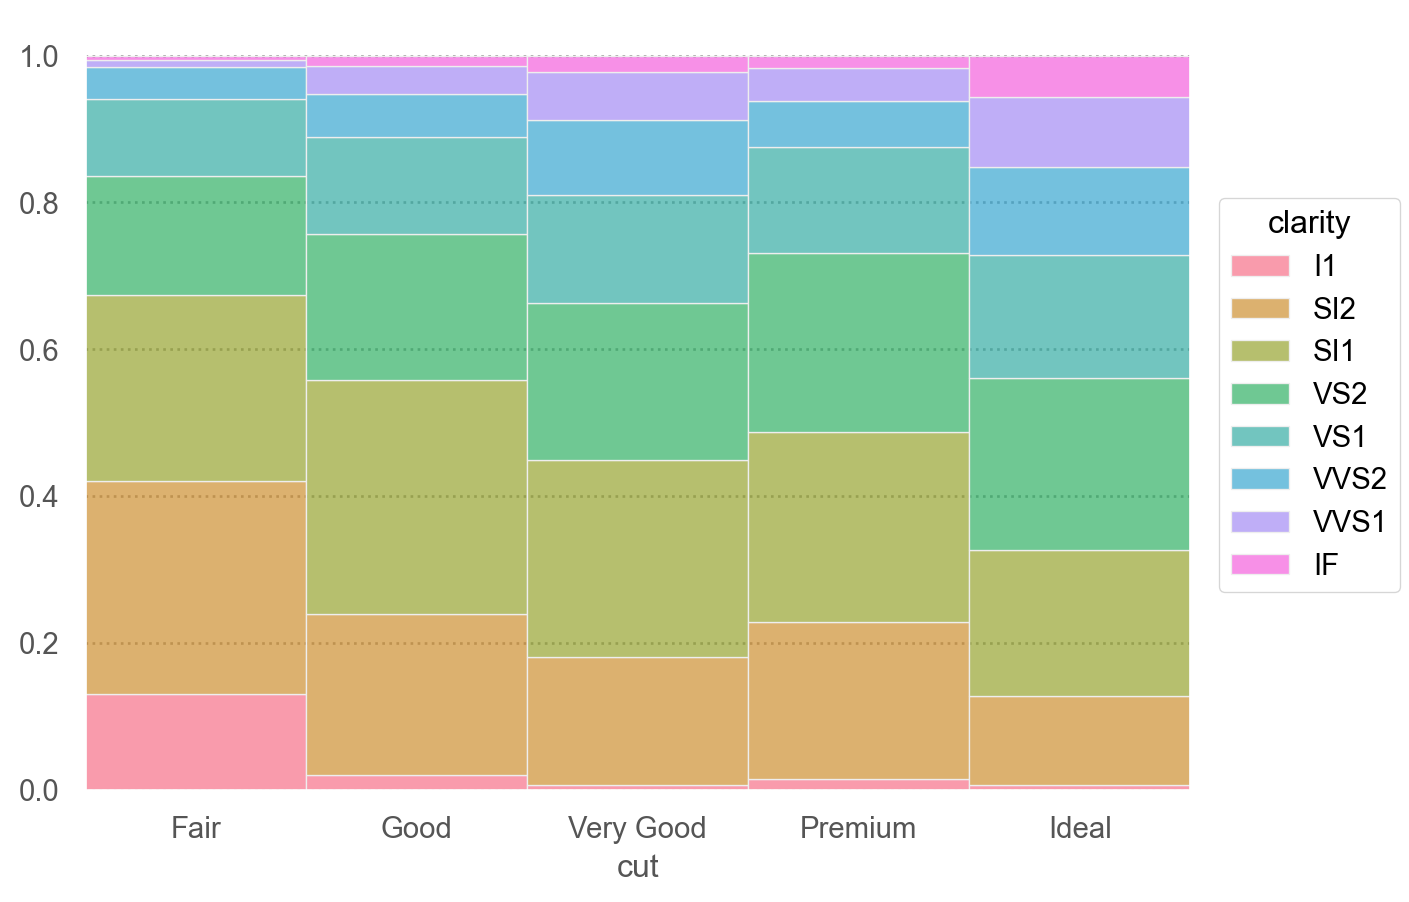
cut와 clarity 사이에 약한 상관관계를 맺는 것으로 보임
= (= "cut" , y= "clarity" , pointsize= "n" , color= "n" )= (5 , 30 ))= (= 'cut' , y= 'clarity' )3 ))
= 'cut' , color= 'clarity' )= 'proportion' , common_norm= ["x" ]), so.Stack())= so.Nominal(order= diamonds.clarity.cat.categories))
/Users/skcho/miniconda3/envs/envconda/lib/python3.11/site-packages/seaborn/_stats/counting.py:228: UserWarning: Undefined variable(s) passed for Hist.common_norm: 'x'.
  self._check_grouping_vars("common_norm", grouping_vars)
순서가 없는 범주형 변수인 경우, 행과 열을 유사한 정도에 따라 순서를 매기는 알고리즘을 통해 재정렬하여 패턴을 볼 수도 있음
= sm.datasets.get_rdataset("gapminder" , "gapminder" ).data
          country continent  year  lifeExp       pop  gdpPercap
0     Afghanistan      Asia  1952    28.80   8425333     779.45
1     Afghanistan      Asia  1957    30.33   9240934     820.85
2     Afghanistan      Asia  1962    32.00  10267083     853.10
...           ...       ...   ...      ...       ...        ...
1701     Zimbabwe    Africa  1997    46.81  11404948     792.45
1702     Zimbabwe    Africa  2002    39.99  11926563     672.04
1703     Zimbabwe    Africa  2007    43.49  12311143     469.71

[1704 rows x 6 columns]
= ('continent == "Asia"' )= "country" , columns= "year" , values= "lifeExp" ) # wide format 변환
country
Afghanistan
28.80
30.33
32.00
34.02
36.09
38.44
39.85
40.82
41.67
41.76
42.13
43.83
Bahrain
50.94
53.83
56.92
59.92
63.30
65.59
69.05
70.75
72.60
73.92
74.80
75.64
Bangladesh
37.48
39.35
41.22
43.45
45.25
46.92
50.01
52.82
56.02
59.41
62.01
64.06
...
...
...
...
...
...
...
...
...
...
...
...
...
Vietnam
40.41
42.89
45.36
47.84
50.25
55.76
58.82
62.82
67.66
70.67
73.02
74.25
West Bank and Gaza
43.16
45.67
48.13
51.63
56.53
60.77
64.41
67.05
69.72
71.10
72.37
73.42
Yemen, Rep.
32.55
33.97
35.18
36.98
39.85
44.17
49.11
52.92
55.60
58.02
60.31
62.70
33 rows × 12 columns
# hierarchical clustering in scipy = False , method= "ward" );
Hierarchical Clustering
import scipy.cluster.hierarchy as sch= sch.dendrogram(= "ward" ),= plotdata.index,= "left" ,= True , # dendrogram plot 생략 'continent == "Asia"' )= "year" , y= "country" , color= "lifeExp" ) # pipe operator = 12 , marker= "s" )) # square marker = so.Nominal(order= dendrogram["ivl" ]), color= "rocket" )= (4 , 7 ))
연습문제
How could you rescale the count dataset above to more clearly show the distribution of cut within colour, or colour within cut?
count 대신 비율을 계산 후 그려보세요.
예를 들어, color D에 cut 각각의 비율들을 구해 시각화
"cut" ], diamonds["color" ], normalize= 'columns' ) # 'columns': 비율을 구하는 방향
Explore how average flight departure delays vary by destination and month of year. What makes the plot difficult to read? How could you improve it?
groupby(["month", "dest"])로 그룹핑을 해서 시작해 볼 것결측치를 어떻게 처리하면 좋을지 생각해 볼 것
sns.clustermap() 또는 위의 dendrogram을 직접 이용한 플랏도 그려볼 것
Two continuous variables
Scatterplot, 2d-histogram
Discretize: pd.cut(), pd.qcut()
'carat < 3' ), x= "carat" , y= "price" )= 1 / 100 , color= ".6" ))5 ))
2d-histogram: x, y축 모두 binning
from matplotlib.colors import LogNorm= "carat" , y= "price" , kind= "hex" , gridsize= 30 , height= 5 , norm= LogNorm()); # gridsize: bin 개수 Discretize: 연속 변수를 카테고리화
= diamonds.query("carat < 3" ).assign(= lambda x: pd.cut(x.carat, 20 , labels= False ),= lambda x: pd.qcut(x.carat, 20 , labels= False ),
= "carat_cat" , y= "price" , fill= False );
= "carat_cat" , y= "price" )
= "carat_qcat" , y= "price" , fill= False );
연습문제
Instead of summarising the conditional distribution with a boxplot, you could use a frequency polygon.
즉, 두 연속변수 중 하나를 카테고리화하는데, boxplot대신 frequency polygon으로 그려볼 것
Visualise the distribution of carat, partitioned by price.
How does the price distribution of very large diamonds compare to small diamonds? Is it as you expect, or does it surprise you?
Combine two of the techniques you’ve learned to visualise the combined distribution of cut, carat, and price.
Two dimensional plots reveal outliers that are not visible in one dimensional plots. For example, some points in the plot below have an unusual combination of x and y values, which makes the points outliers even though their x and y values appear normal when examined separately.
= 'x' , y= 'y' )= (4 , 11 ), y= (4 , 11 ))
Patterns and models
만약 두 변수 간의 체계적인 관계가 있다면, 데이터에서 어떤 식으로든 패턴으로 나타날 것이고, 이러한 패턴을 찾으면서 변수 간의 진정한 관계를 추적해 나감.
패턴은 데이터 분석가에게 가장 유용한 도구 중 하나임
패턴을 발견했다면, (잠정적) 모형(model)을 명시적으로 세운 후 탐색을 진행
패턴을 발견했다면 다음과 같은 질문을 해 볼 것
이 패턴이 우연에 의한 것인가?
이 패턴이 암시하는 관계를 어떻게 묘사해 볼 수 있는가?
이 패턴이 암시하는 관계가 얼마나 강한가?
어떤 다른 변수들이 이 관계에 영향을 줄 수 있는가? ex) 운동의 효과가 어느 때 하는가에 달라지는가?
데이터의 하위그룹별로 봤을 때, 이 관계가 변하는가? ex) 남녀에게 효과가 다른가?
Example: Old Faithful eruption (간헐천)
= sm.datasets.get_rdataset("faithful" , "datasets" ).data3 )
   eruptions  waiting
0       3.60       79
1       1.80       54
2       3.33       74
= 'eruptions' , y= 'waiting' )
패턴:
오래 있다가 분출할 수록 더 오랜 기간 분출
두개의 군집을 형성
변동(variation) 을 불확실성을 만들어내는 현상으로 생각한다면, 공변동(covariation) 는 불확실성을 줄이는 현상입니다. 두 변수가 공변하면, 한 변수의 값을 사용해 두 번째 변수의 값에 대해 더 나은 예측 을 할 수 있습니다. 만약 공변동이 인과관계(특수한 경우)로 인한 것이라면, 한 변수의 값을 사용하여 두 번째 변수의 값을 제어 할 수 있습니다.
If you think of variation as a phenomenon that creates uncertainty , covariation is a phenomenon that reduces it . If two variables covary, you can use the values of one variable to make better predictions about the values of the second. If the covariation is due to a causal relationship (a special case), then you can use the value of one variable to control the value of the second.
패턴이 보이면, 이를 구체적으로 명시하는 모델을 세워 분석을 진행
Buliding models
Diamonds 데이터셋에서,
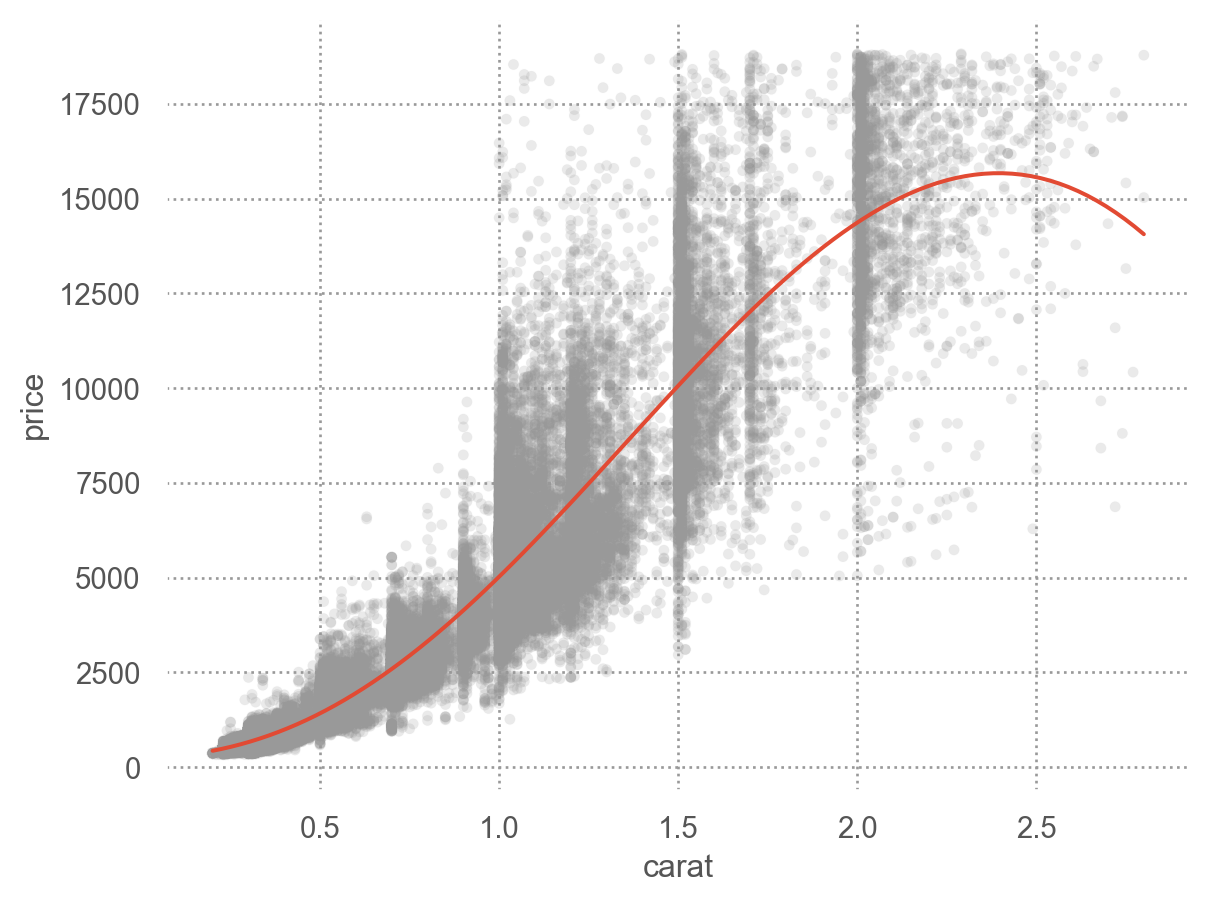
모델링을 통해 가격(price)과 크기(carat) 사이의 강한 관계를 제거할 수 있도록 모델을 세울 수 있음
이 관계를 제거한 후 남은 패턴 을 탐색할 수 있음
Build a model!
Linear model, 선형(직선) 모형을 여기서는 특히, \(y = b_1x + b_0\) 인 1차 함수꼴의 모형으로 세움
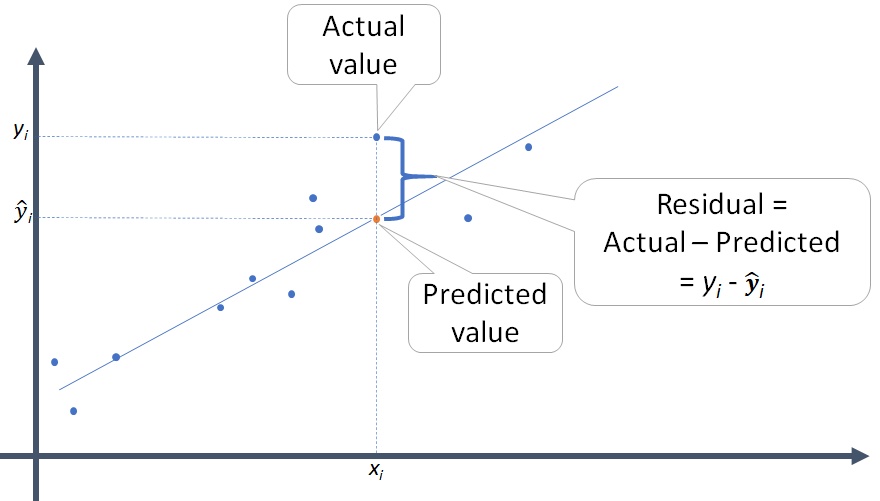
\(price = b_1 * carat + b_0 + e\) (residual/error, 잔차/예측오차 )의 모형을 세운 후 데이터에 가장 적합한(fit ) 파라미터 \(b_1, b_0\) 값을 구하는 과정: fitted model
import statsmodels.formula.api as smf= diamonds.query("carat < 3" )= smf.ols("price ~ carat" , data= diamonds2).fit()= diamonds2.assign(= diamonds_fit.fittedvalues,= diamonds_fit.resid,126 )"cut" , "carat" , "price" , "pred" , "resid" ]].sample(7 )
             cut  carat  price     pred    resid
32609      Ideal   0.31    802   117.54   684.46
16255      Ideal   1.35   6502  8263.21 -1761.21
17451      Ideal   1.01   6999  5600.20  1398.80
16089       Good   1.01   6429  5600.20   828.80
42762    Premium   0.56   1345  2075.63  -730.63
26768       Good   2.02  16593 13510.90  3082.10
47809  Very Good   0.71   1902  3250.49 -1348.49
print (diamonds_fit.params) # print coefficients print (f"R2 = { diamonds_fit. rsquared:.3f} " ) # print R-squared
Intercept   -2310.50
carat        7832.37
dtype: float64
R2 = 0.853
residuals (잔차)은 모형이 예측하지 못하는 정도를 나타내며, 그것들의 총체를 줄이는 것이 좋은 모형임.
크기(carat)로 가격(price)을 예측/설명(account for) 하는 정도를 제거한 후, 즉, 크기(carat)로 예측/설명되지 않는 가격(price)의 정도에 대해서 다른 변수들과의 관계를 탐구
= 'carat' , y= 'resid' )= ".6" , alpha= 1 / 100 ))= "red" ), so.Agg(lambda x: 0 ))
캐럿(carat)으로 설명되지 않는 가격의 값들로만 추가 분석을 실시하면,cut으로 “다이아몬드의 무게로는 설명되지 않는 가격”의 변량을 얼마나 추가로 설명할 수 있는가?
from sbcustom import rangeplot= "cut" , y= "resid" )= "red" ), so.Agg(lambda x: 0 ))
다이아몬드의 무게로 가격을 설명한 후 남은(residualized) 가격의 변량을 cut이 어떻게 예측하는가?
다이아몬드의 무게로 설명되지(not acounted for) 않는 가격의 변량을 cut이 어떻게 예측하는가?
다이아몬드의 무게가 가격에 미친 영향을 제거한 후, 혹은 그 영향을 넘어서서 (above and beyond) cut이 어떻게 가격을 예측하는가?
다이아몬드의 무게(carat)가 동일하다면, 즉 무게가 고정된다면 (hold it constant), 무게의 영향이 제거된 다이아몬드의 퀄리티(cut, …)에 따른 가격에 대한 관계가 나타날 것임.
다음과 같이 다이아몬드의 무게를 비슷한 구간으로 나누어 살펴보면,
"carat_cat" ] = pd.qcut(diamonds2["carat" ], 12 )= 'cut' , y= 'price' )"carat_cat" , wrap= 3 )= False )= (8 , 8 ))
Exercises
Ames Housing Dataset: AmesHousing.csv Kaggle competition 페이지 를 참고; 단, 이 페이지에서는 train, test 데이터셋으로 나뉘어 있음.
# import = pd.read_csv("data/AmesHousing.csv" )# column 이름에서 space와 /를 제거 = housing.columns.str .replace(" " , "" ).str .replace("/" , "" )# 불필요한 column 제거 = ["Order" , "PID" , "SaleType" ], inplace= True )# outlier 제거 = housing.query("GrLivArea < 4000 & SalePrice < 700000" ) # 5 obs removed # remodel 여부 = (housing["YearRemodAdd" ] - housing["YearBuilt" ]) == 0 "Remodel" ] = np.where(idx, "No" , "Yes" )
위 데이터를 이용하여, 이 단원에서 다룬 탐색적 분석을 연습
집 값을 예측하는 변수들 중 관심있는 변수들을 선택하면서; 선택이 어려우면 아래 변수들 안에서 살펴볼 것
= ["YearBuilt" , "YearRemodAdd" , "GrLivArea" , "TotalBsmtSF" , "BsmtExposure" , "GarageCars" , "GarageArea" , "GarageType" , "Fireplaces" , "KitchenQual" , "Neighborhood" , "Remodel" ]
YearBuilt: Original construction date
YearRemodAdd: Remodel date
GrLivArea: Above grade (ground) living area square feet
TotalBsmtSF: Total square feet of basement area
BsmtExposure: Refers to walkout or garden level walls
Gd Good Exposure
Av Average Exposure (split levels or foyers typically score average or above)
Mn Mimimum Exposure
No No Exposure
NA No Basement
GarageCars: Size of garage in car capacity
GarageArea: Size of garage in square feet
Fireplaces: Number of fireplaces
KitchenQual: Kitchen quality
Ex Excellent
Gd Good
TA Typical/Average
Fa Fair
Po Poor
Neighborhood: Physical locations within Ames city limits
Remodel: 리모델링 여부에 대해 위 전처리에서 생성; Yes/No
질문과 함께 분석을 실시, 예를 들어
어떤 종류의 garage가 있으며 그 분포는 어떠한가?; variation - categorical variables
어떤 garage 타입이 집값과 어떻게 관계를 맺는가?; covariation - a categorical and continuous variable
집 값에 가장 크게 영향을 주는 요소는? GrLivArea?; covariation - two continuous variables
Q1. 우선, 집이 지어진 연도(YearBuilt)와 리모델링 연도(YearRemodAdd)를 다음과 같이 살펴보고,
두 변수가 어떻게 코딩되었는지 이해해보고
집값은 지어진 연도(YearBuilt)와는 거의 상관이 없고, 리모델링 연도(YearRemodAdd)와만 연관성이 높은지 살펴보세요.
= 'YearRemodAdd' , y= 'YearBuilt' , color= "Remodel" )= .2 ))5 ))"Remodel" )= (7 , 4 ))= ".1" ), y= 'YearRemodAdd' ) # y=x 라인을 추가
Q2. 동네에 따른 집값(SalePrice)과 집의 크기(GrLivArea)의 관계를 살펴보세요.
= "Neighborhood" )= ["SalePrice" , "GrLivArea" ])= .1 ))= ".2" , marker= "." ), so.Agg("median" ))= (7 , 5 ))
= ["YearBuilt" , "YearRemodAdd" , "GrLivArea" , "TotalBsmtSF" , "BsmtExposure" , "GarageCars" , "GarageArea" , "GarageType" , "Fireplaces" , "KitchenQual" , "Neighborhood" ]for x in X:= (= x, y= "SalePrice" )= .1 ))= ".3" ), so.PolyFit(5 ))

