Load packages
# numerical calculation & data frames import numpy as npimport pandas as pd# visualization import matplotlib.pyplot as pltimport seaborn as snsimport seaborn.objects as so# statistics import statsmodels.api as sm# pandas options 'mode.copy_on_write' , True ) # pandas 2.0 = ' {:.2f} ' .format # pd.reset_option('display.float_format') = 7 # max number of rows to display # NumPy options = 2 , suppress= True ) # suppress scientific notation # For high resolution display import matplotlib_inline"retina" )
What affects the number of daily flights?
= sm.datasets.get_rdataset('flights' , 'nycflights13' ).data
# Make dates from year, month, day "date" ] = pd.to_datetime(flights[["year" , "month" , "day" ]])
= flights.groupby("date" ).size().reset_index(name= "n" )
          date    n
0   2013-01-01  842
1   2013-01-02  943
2   2013-01-03  914
..         ...  ...
362 2013-12-29  888
363 2013-12-30  968
364 2013-12-31  776

[365 rows x 2 columns]
= 'date' , y= 'n' )= (8 , 4 ))
1. Day of week (요일)
항공편의 개수는 요일에 따른 효과가 크게 미치기 때문에 우선 요일의 효과를 살펴보면서 장기간의 트렌드를 이해하고자 함
# Add a column for the day of the week "wday" ] = pd.Categorical("date" ].dt.day_name().str [:3 ],= ["Sun" , "Mon" , "Tue" , "Wed" , "Thu" , "Fri" , "Sat" ],= True ,
          date    n wday
0   2013-01-01  842  Tue
1   2013-01-02  943  Wed
2   2013-01-03  914  Thu
..         ...  ...  ...
362 2013-12-29  888  Sun
363 2013-12-30  968  Mon
364 2013-12-31  776  Tue

[365 rows x 3 columns]
from sbcustom import boxplot"wday" , "n" , alpha= .5 )
매우 강한 주말 효과를 제거하기 위해 모델을 만들어 residuals을 얻음
import statsmodels.formula.api as smf= smf.ols("n ~ wday" , data= daily).fit()
Intercept      891.48
wday[T.Mon]     83.33
wday[T.Tue]     59.88
wday[T.Wed]     71.21
wday[T.Thu]     74.27
wday[T.Fri]     75.98
wday[T.Sat]   -146.87
dtype: float64
# Prediction = pd.DataFrame({"wday" : ["Sun" , "Mon" , "Tue" , "Wed" , "Thu" , "Fri" , "Sat" ]})"pred" ] = mod.predict(grid)"wday" )["n" ].mean()
  wday   pred
0  Sun 891.48
1  Mon 974.81
2  Tue 951.36
3  Wed 962.69
4  Thu 965.75
5  Fri 967.46
6  Sat 744.62
wday
Sun   891.48
Mon   974.81
Tue   951.36
Wed   962.69
Thu   965.75
Fri   967.46
Sat   744.62
Name: n, dtype: float64
"wday" , "n" , alpha= .5 )= "blue" , marker= "<" ), x= grid.wday, y= grid.pred) # prediction 추가 = so.Nominal(order= ["Sun" , "Mon" , "Tue" , "Wed" , "Thu" , "Fri" , "Sat" ]))
Residuals: 요일의 효과를 제거한 후의 날짜와 항공편의 개수의 관계
# Add a column of residuals from mod "resid" ] = mod.resid
= 'date' , y= 'resid' )= "red" , linestyle= ":" ), so.Agg(lambda x: 0 ))= (8 , 4 ))
살펴볼 것들
6월부터 모델이 잡아내지 못한 패턴들이 심해짐. 이를 위해 우선, 요일별로 잔차를 들여다 보면,
= 'date' , y= 'resid' , color= "wday" )= ".6" , linestyle= ":" ), so.Agg(lambda x: 0 ))= (8 , 4 ))
토요일의 패턴을 잡아내지 못했음:
특히나 적은 항공편이 있는 날들이 있어서 그 날들을 살펴보면
'resid < -100' )
          date    n wday   resid
0   2013-01-01  842  Tue -109.36
19  2013-01-20  786  Sun -105.48
145 2013-05-26  729  Sun -162.48
184 2013-07-04  737  Thu -228.75
185 2013-07-05  822  Fri -145.46
243 2013-09-01  718  Sun -173.48
331 2013-11-28  634  Thu -331.75
332 2013-11-29  661  Fri -306.46
357 2013-12-24  761  Tue -190.36
358 2013-12-25  719  Wed -243.69
364 2013-12-31  776  Tue -175.36
미국 공휴일에 해당하는 날들로 보임: 새해, 독립기념일(7/4), 추수감사절, 크리스마스 등등
공휴일 확인
import holidays= holidays.UnitedStates()= daily.query('resid < -100' )'holiday_name' ] = df['date' ].apply (lambda x: us_holidays.get(x, "Not a holiday" ))
          date    n wday   resid      holiday_name
0   2013-01-01  842  Tue -109.36    New Year's Day
19  2013-01-20  786  Sun -105.48     Not a holiday
145 2013-05-26  729  Sun -162.48     Not a holiday
184 2013-07-04  737  Thu -228.75  Independence Day
185 2013-07-05  822  Fri -145.46     Not a holiday
243 2013-09-01  718  Sun -173.48     Not a holiday
331 2013-11-28  634  Thu -331.75      Thanksgiving
332 2013-11-29  661  Fri -306.46     Not a holiday
357 2013-12-24  761  Tue -190.36     Not a holiday
358 2013-12-25  719  Wed -243.69     Christmas Day
364 2013-12-31  776  Tue -175.36     Not a holiday
일년에 걸쳐 나타나는 장기간의 트렌드가 있어보임: so.Polyfit(5)을 이용해 시각화해보면
= 'date' , y= 'resid' )= ".5" ))5 ))= "red" , linestyle= ":" ), so.Agg(lambda x: 0 ))= (8 , 4 ))
다항함수 fit 보다 좀 더 flexible한 natural spline 으로 fit을 하면,patsy 패키지의 cr 함수를 이용: spline regression
# 일년 중 몇 일째인지 수치형 변수로 추가: cr함수가 datetime을 처리하지 못함. "day" ] = daily["date" ].dt.day_of_year
# 10개의 조각으로 이루어진 cubic(3차) natural spline = smf.ols("resid ~ cr(day, df=10)" , data= daily).fit()"ns_fitted" ] = fit_spline.fittedvalues
Natual spline은 일반적인 B-splines에 비해 양 끝단에서 flat하도록 제한을 둔 것
General B-splines의 예: patsy 패키지의 bs 함수를 이용
= smf.ols("resid ~ bs(day, df=10, degree=1)" , data= daily).fit()"bs_fitted" ] = fit_bspline.fittedvalues
        date    n wday   resid  day  ns_fitted
0 2013-01-01  842  Tue -109.36    1     -56.91
1 2013-01-02  943  Wed  -19.69    2     -56.86
2 2013-01-03  914  Thu  -51.75    3     -56.80
3 2013-01-04  915  Fri  -52.46    4     -56.75
4 2013-01-05  720  Sat  -24.62    5     -56.68
5 2013-01-06  832  Sun  -59.48    6     -56.61
6 2013-01-07  933  Mon  -41.81    7     -56.54
= (= 'day' , y= 'resid' )= ".6" ))= "red" , linestyle= ":" ), so.Agg(lambda x: 0 ))= daily.ns_fitted) # predicted line by natural spline model = (8 , 4 ))
겨울에 좀 적으며, 여름에 많음: 여러 해의 데이터가 있다면 이 패턴을 구체화 할 수 있으나 2013년의 데이터만 있으므로 우리의 지식에 의존해서 설명해 볼 수 밖에 없음
참고로 위에서 언급한 B-splines를 이용한 모델에 의한 예측값을 추가로 그리면,
# Predicted line by B-spline model: 1차 함수(직선), 10개의 pieces로 나누어짐 = smf.ols("resid ~ bs(day, df=10, degree=1)" , data= daily).fit()"bs_fitted" ] = fit_bspline.fittedvalues= "blue" ), y= daily.bs_fitted)
2. Seasonal Saturday effect (계절)
앞서 말한 살펴볼 3가지 중에 첫번째 부분, 즉 토요일에 대해 나타나는 패턴을 잡아내기 위해
'wday == "Sat"' ), x= 'date' , y= 'n' )= "." ))= (8 , 4 ))
여름에는 토요일에 여행하는 걸 마다하지 않는 것은 아마도 여름 방학이나 휴가철이라 그런 것일 듯,
가을에 토요일 항공편이 적은 것은 미국에서는 추수감사절이나 크리스마스와 같은 큰 공휴일들이 있어 가족여행을 계획하지 않는다고 하는데 추측해 볼 뿐임.
대략 3개의 school terms으로 나누어 우리의 추측을 확인해보고자 함
= pd.to_datetime(["2013-01-01" , "2013-06-05" , "2013-08-25" , "2014-01-01" ])# cut의 나눌 위치를 직접 지정 "term" ] = pd.cut("date" ], dates_cut, right= False , labels= ["spring" , "summer" , "fall" ]
'wday == "Sat"' ), x= 'date' , y= 'n' , color= "term" )= "." ))= (8 , 4 ))
이 term 변수가 토요일이 아닌 다른 요일에는 어떻게 작용하는지 살펴보면
= "wday" , y= "n" , color= "term" , alpha= .5 )
3개의 term에 따라 각 요일에서의 항공편의 개수가 큰 차이가 나는 것으로 보이며, 그 패턴이 요일마다 다른 것으로 보이므로, 각 term에 따라 요일의 효과를 분리해서 보는 것이 타당해보임.
Model building
앞에서 탐색한 결과를 바탕으로, 하루에 출항하는 항공편의 개수를 예측하는데
요일로만 예측하는 모델 (mod1)과
요일과 term, 그리고 그 둘의 상호작용을 함께 고려한 모델 (mod2)을 세워 비교해보면,
= smf.ols("n ~ wday" , data= daily).fit() # 요일로만 예측 = smf.ols("n ~ wday * term" , data= daily).fit() # 요일과 term, 그리고 요일과 term의 interaction으로 예측
from patsy import dmatrices= dmatrices("n ~ wday * term" , data= daily, return_type= "dataframe" )
Index(['Intercept', 'wday[T.Mon]', 'wday[T.Tue]', 'wday[T.Wed]', 'wday[T.Thu]',
       'wday[T.Fri]', 'wday[T.Sat]', 'term[T.summer]', 'term[T.fall]',
       'wday[T.Mon]:term[T.summer]', 'wday[T.Tue]:term[T.summer]',
       'wday[T.Wed]:term[T.summer]', 'wday[T.Thu]:term[T.summer]',
       'wday[T.Fri]:term[T.summer]', 'wday[T.Sat]:term[T.summer]',
       'wday[T.Mon]:term[T.fall]', 'wday[T.Tue]:term[T.fall]',
       'wday[T.Wed]:term[T.fall]', 'wday[T.Thu]:term[T.fall]',
       'wday[T.Fri]:term[T.fall]', 'wday[T.Sat]:term[T.fall]'],
      dtype='object')
= daily.assign(= mod1.resid,= mod2.resid,
          date    n wday   resid  day  ns_fitted  bs_fitted    term  \
0   2013-01-01  842  Tue -109.36    1     -56.91     -55.93  spring
1   2013-01-02  943  Wed  -19.69    2     -56.86     -55.78  spring
2   2013-01-03  914  Thu  -51.75    3     -56.80     -55.63  spring
..         ...  ...  ...     ...  ...        ...        ...     ...
362 2013-12-29  888  Sun   -3.48  363     -39.96     -37.80    fall
363 2013-12-30  968  Mon   -6.81  364     -41.10     -38.74    fall
364 2013-12-31  776  Tue -175.36  365     -42.24     -39.68    fall

     without_term  with_term
0         -109.36     -98.26
1          -19.69      -8.64
2          -51.75     -51.36
..            ...        ...
362         -3.48      -7.00
363         -6.81     -11.26
364       -175.36    -167.58

[365 rows x 10 columns]
= daily.melt(id_vars= ["date" ], value_vars= ["without_term" , "with_term" ], var_name= "model" , value_name= "residual" )
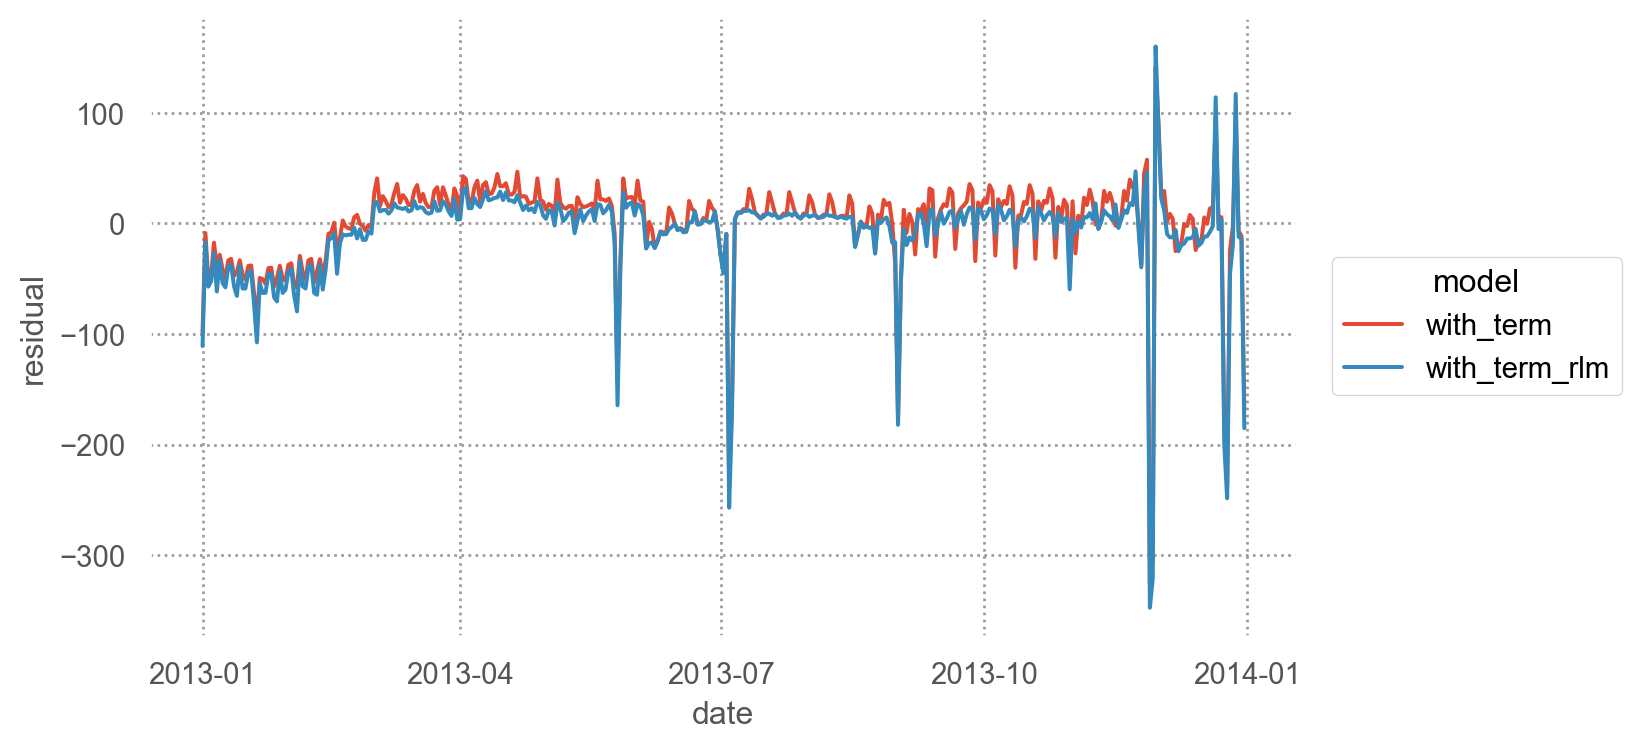
= 'date' , y= 'residual' , color= "model" )= .75 ))= (8 , 4 ))
시즌(term)을 포함한 모델이 약간 나아보이나 좀 더 살펴보고자, 원래의 데이터와 함께 플랏을 그려보면,
= ["Sun" , "Mon" , "Tue" , "Wed" , "Thu" , "Fri" , "Sat" ]= ["spring" , "summer" , "fall" ]# make a grid of wday and term from itertools import product= pd.DataFrame(list (product(wday_grid, term_grid)),= ["wday" , "term" ],
   wday    term
0   Sun  spring
1   Sun  summer
2   Sun    fall
..  ...     ...
18  Sat  spring
19  Sat  summer
20  Sat    fall

[21 rows x 2 columns]
"pred_mod2" ] = mod2.predict(grid[["wday" , "term" ]])
   wday    term  pred_mod2
0   Sun  spring     872.23
1   Sun  summer     923.91
2   Sun    fall     895.00
..  ...     ...        ...
18  Sat  spring     737.32
19  Sat  summer     800.92
20  Sat    fall     716.00

[21 rows x 3 columns]
= daily.merge(grid)
          date    n wday   resid  day  ns_fitted  bs_fitted    term  \
0   2013-01-01  842  Tue -109.36    1     -56.91     -55.93  spring
1   2013-01-02  943  Wed  -19.69    2     -56.86     -55.78  spring
2   2013-01-03  914  Thu  -51.75    3     -56.80     -55.63  spring
..         ...  ...  ...     ...  ...        ...        ...     ...
362 2013-12-29  888  Sun   -3.48  363     -39.96     -37.80    fall
363 2013-12-30  968  Mon   -6.81  364     -41.10     -38.74    fall
364 2013-12-31  776  Tue -175.36  365     -42.24     -39.68    fall

     without_term  with_term  pred_mod2
0         -109.36     -98.26     940.26
1          -19.69      -8.64     951.64
2          -51.75     -51.36     965.36
..            ...        ...        ...
362         -3.48      -7.00     895.00
363         -6.81     -11.26     979.26
364       -175.36    -167.58     943.58

[365 rows x 11 columns]
= "wday" , y= "n" )= "blue" ), y= "pred_mod2" ) # prediction 값을 추가 "term" )= (7.5 , 5 ))
이상치(ourliers)가 많아 평균(mean)의 값이 중앙값 (median)보다 많이 내려와 있는 경향을 보이고 있음.robust regression 모형 (mod3)을 세워 해결해보면,
# Robust Linear Model (RLM) in statsmodels = sm.RLM.from_formula("n ~ wday * term" , data= daily).fit()
## Predictions # mod2: smf.ols("n ~ wday * term", data=daily) "with_term_ols" ] = mod2.predict(grid[["wday" , "term" ]])# mod3: robust mod2 "with_term_rlm" ] = mod3.predict(grid[["wday" , "term" ]])
# Median 값 추가 = daily.groupby(["wday" , "term" ])["n" ].median().reset_index(name= "median" )
= grid.merge(daily_median, on= ["wday" , "term" ])
   wday    term  pred_mod2  with_term_ols  with_term_rlm  median
0   Sun  spring     872.23         872.23         893.50  901.00
1   Sun  summer     923.91         923.91         923.91  929.00
2   Sun    fall     895.00         895.00         900.09  902.00
..  ...     ...        ...            ...            ...     ...
18  Sat  spring     737.32         737.32         746.82  747.00
19  Sat  summer     800.92         800.92         801.22  808.00
20  Sat    fall     716.00         716.00         696.90  690.00

[21 rows x 6 columns]
= grid.melt(id_vars= ["wday" , "term" ], value_vars= ["with_term_ols" , "with_term_rlm" , "median" ], var_name= "model" , value_name= "n" )= 'wday' , y= 'n' , color= "model" )= "w" , pointsize= 8 ))"term" )= (7.5 , 5 ))
Final model mod3 = sm.RLM.from_formula("n ~ wday * term", data=daily).fit()
Intercept                     893.50
wday[T.Mon]                    72.65
wday[T.Tue]                    59.34
wday[T.Wed]                    66.27
wday[T.Thu]                    77.63
wday[T.Fri]                    73.70
wday[T.Sat]                  -146.68
term[T.summer]                 30.40
term[T.fall]                    6.58
wday[T.Mon]:term[T.summer]     -1.92
wday[T.Tue]:term[T.summer]      6.69
wday[T.Wed]:term[T.summer]      2.32
wday[T.Thu]:term[T.summer]     -7.51
wday[T.Fri]:term[T.summer]     -5.57
wday[T.Sat]:term[T.summer]     23.99
wday[T.Mon]:term[T.fall]        8.89
wday[T.Tue]:term[T.fall]        1.72
wday[T.Wed]:term[T.fall]        1.21
wday[T.Thu]:term[T.fall]        3.82
wday[T.Fri]:term[T.fall]        8.65
wday[T.Sat]:term[T.fall]      -56.51
dtype: float64
= 'wday' , y= 'with_term_rlm' , color= "term" )= "." ))= (7 , 4 ))
Residuals for mod3
"with_term_rlm" ] = mod3.resid
= daily.melt(= ["date" ],= ["with_term" , "with_term_rlm" ],= "model" ,= "residual" ,
          date          model  residual
0   2013-01-01      with_term    -98.26
1   2013-01-02      with_term     -8.64
2   2013-01-03      with_term    -51.36
..         ...            ...       ...
727 2013-12-29  with_term_rlm    -12.09
728 2013-12-30  with_term_rlm    -13.63
729 2013-12-31  with_term_rlm   -185.15

[730 rows x 3 columns]
= 'date' , y= 'residual' , color= "model" )= (7 , 4 ))
이제 1년에 걸친 장기 트렌드를 더 잘 볼 수 있고, positive한 이상치와 negative한 이상치도 확연히 들어남
Time of year: an alternative approach
위에서는 모델을 향상시키기 위해 우리의 지식을 이용하였는데, 이에 반해
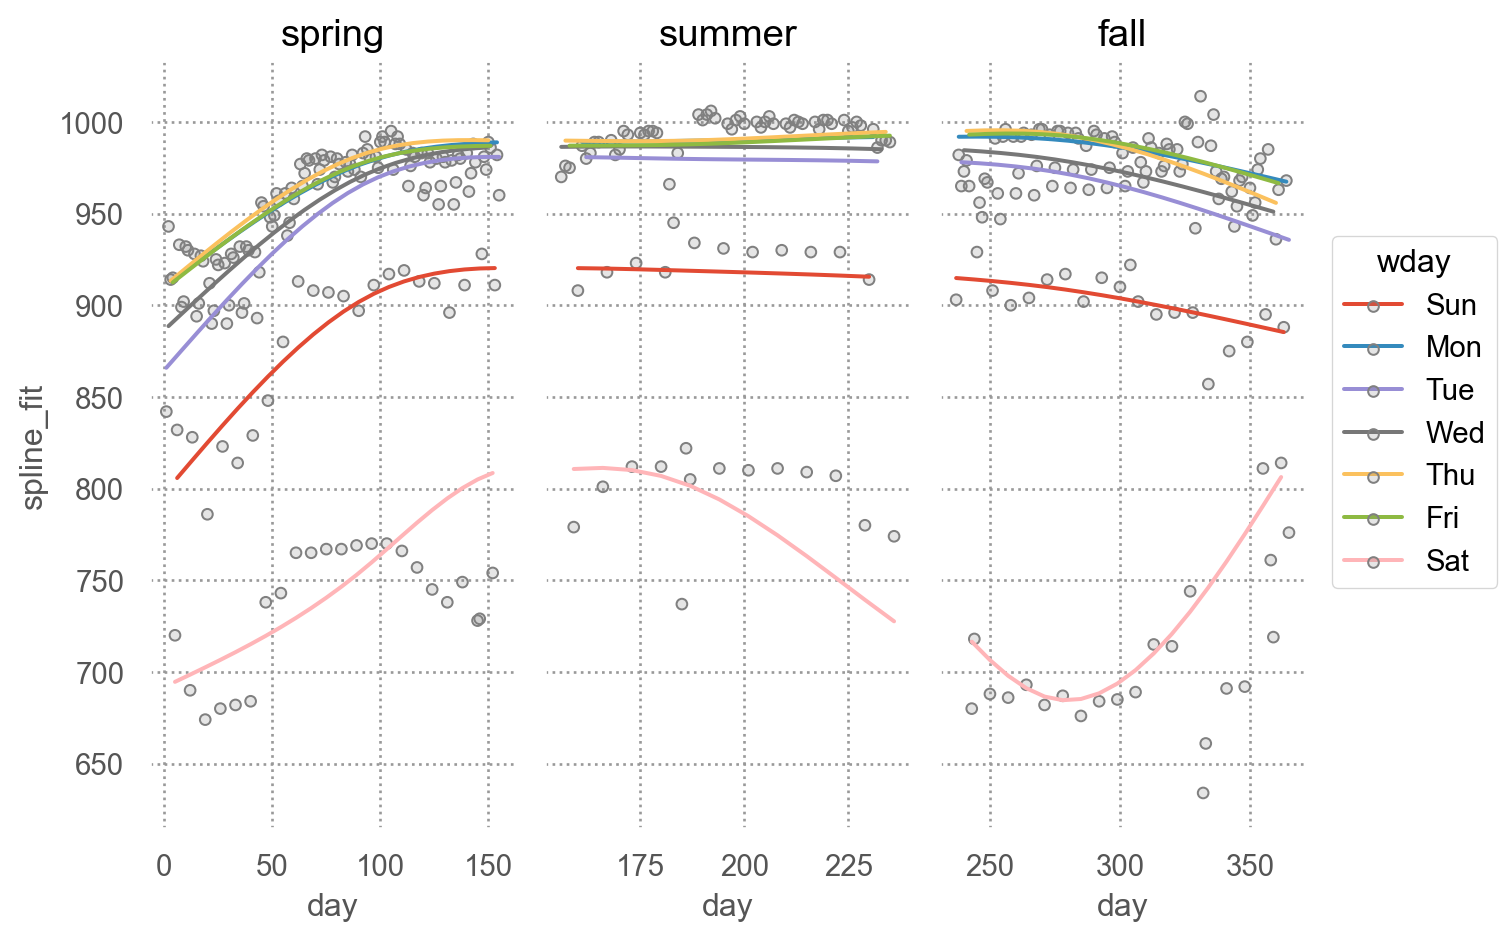
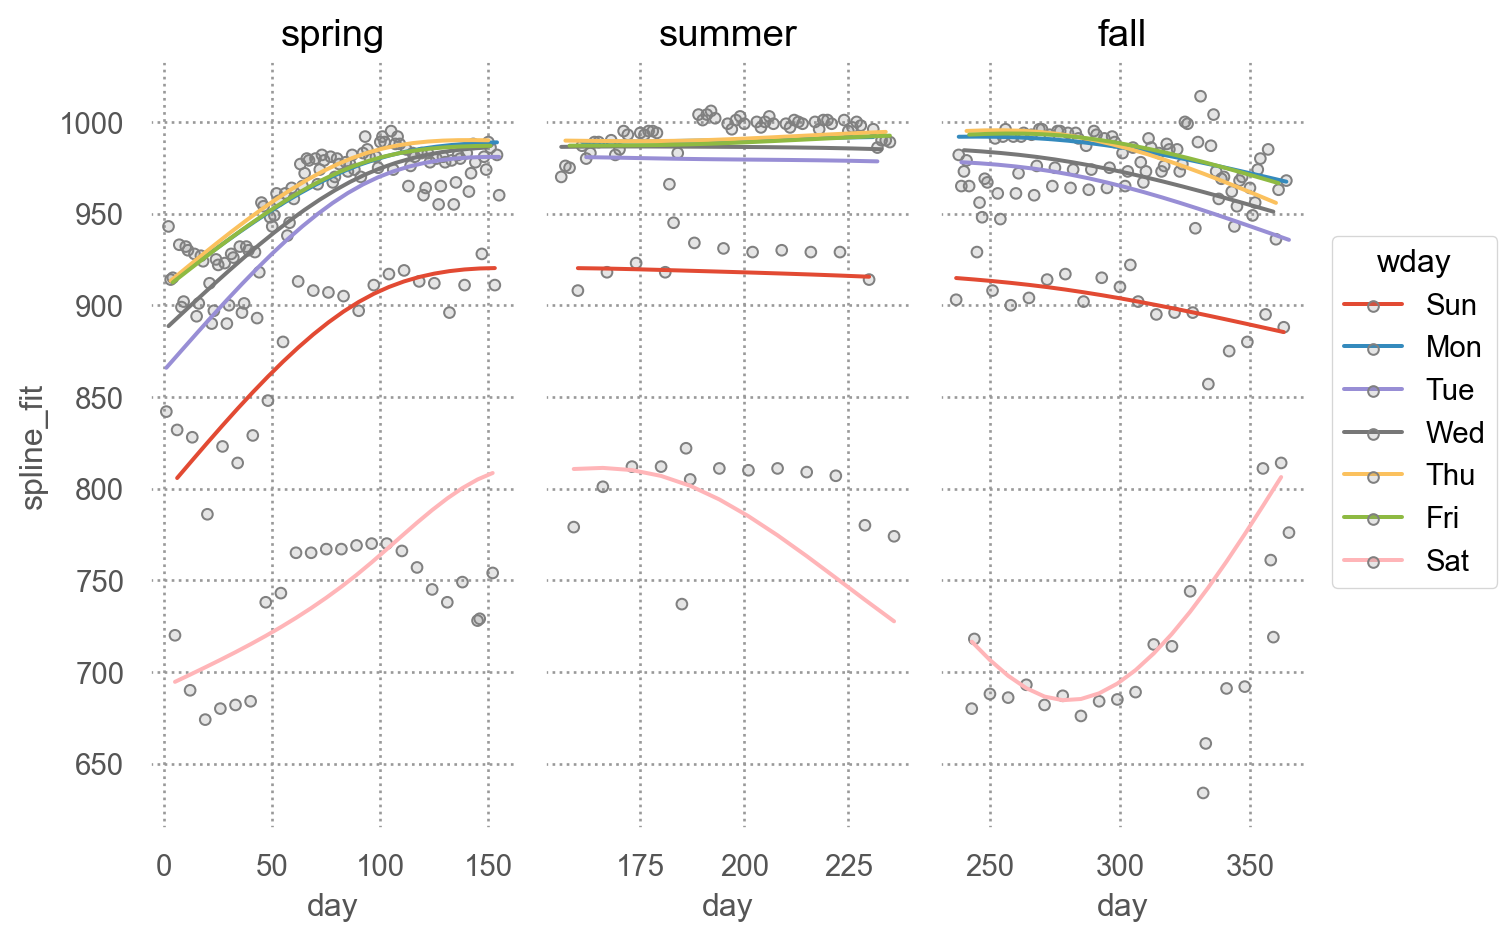
좀 더 유동적인 모델을 이용하여 데이터의 패턴을 잘 잡아내주도록 적절한 모델을 생성하는 방식도 있음
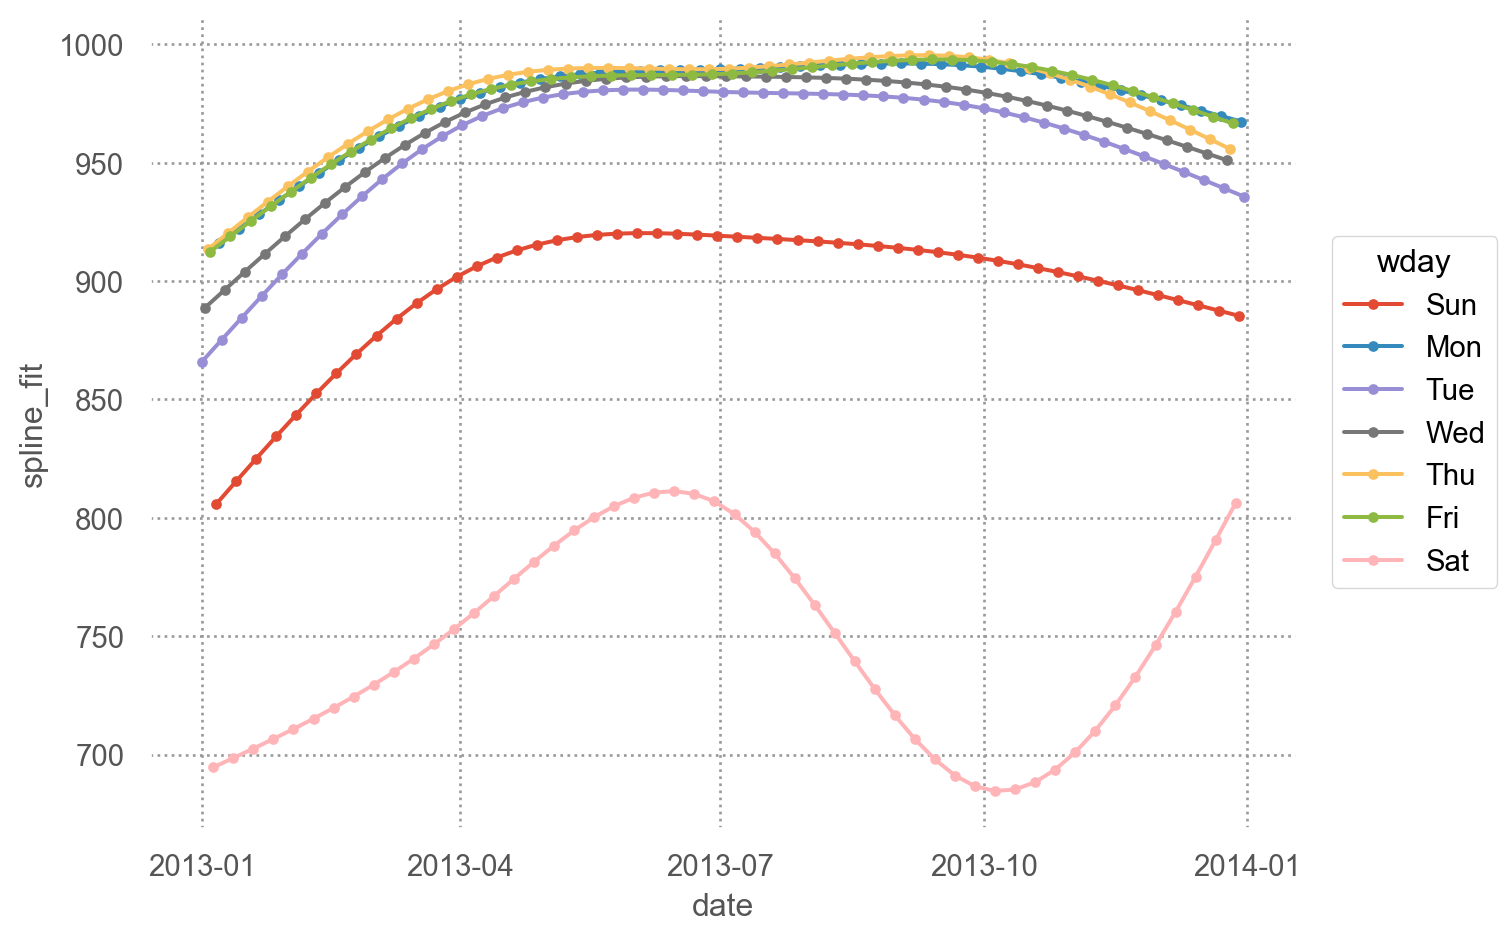
위의 예에서는 선형모델로는 부족하니 natural (cubic) spline을 이용해서 부드러운 곡선에 fit해볼 수 있음
= sm.RLM.from_formula("n ~ wday * cr(day, df=5)" , data= daily).fit()
"spline_fit" ] = mod_spline.fittedvalues
          date    n wday   resid  day  ns_fitted  bs_fitted    term  \
0   2013-01-01  842  Tue -109.36    1     -56.91     -55.93  spring
1   2013-01-02  943  Wed  -19.69    2     -56.86     -55.78  spring
2   2013-01-03  914  Thu  -51.75    3     -56.80     -55.63  spring
..         ...  ...  ...     ...  ...        ...        ...     ...
362 2013-12-29  888  Sun   -3.48  363     -39.96     -37.80    fall
363 2013-12-30  968  Mon   -6.81  364     -41.10     -38.74    fall
364 2013-12-31  776  Tue -175.36  365     -42.24     -39.68    fall

     without_term  with_term  with_term_rlm  spline_fit
0         -109.36     -98.26        -110.84      865.91
1          -19.69      -8.64         -16.78      888.63
2          -51.75     -51.36         -57.14      913.36
..            ...        ...            ...         ...
362         -3.48      -7.00         -12.09      885.37
363         -6.81     -11.26         -13.63      967.40
364       -175.36    -167.58        -185.15      935.67

[365 rows x 12 columns]
= 'date' , y= 'spline_fit' , color= "wday" )= "." ))= (7 , 5 ))
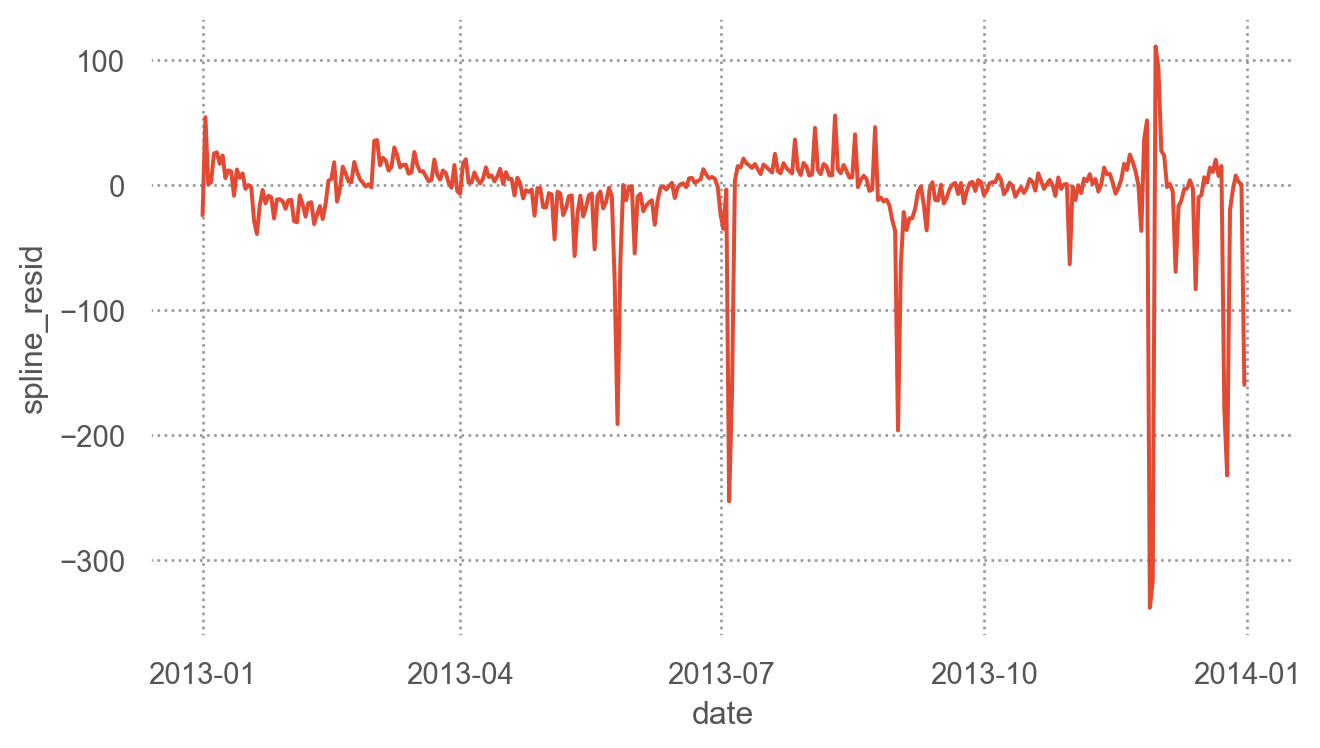
Residuals for mod_spline
"spline_resid" ] = mod_spline.resid
= 'date' , y= 'spline_resid' )= (7 , 4 ))
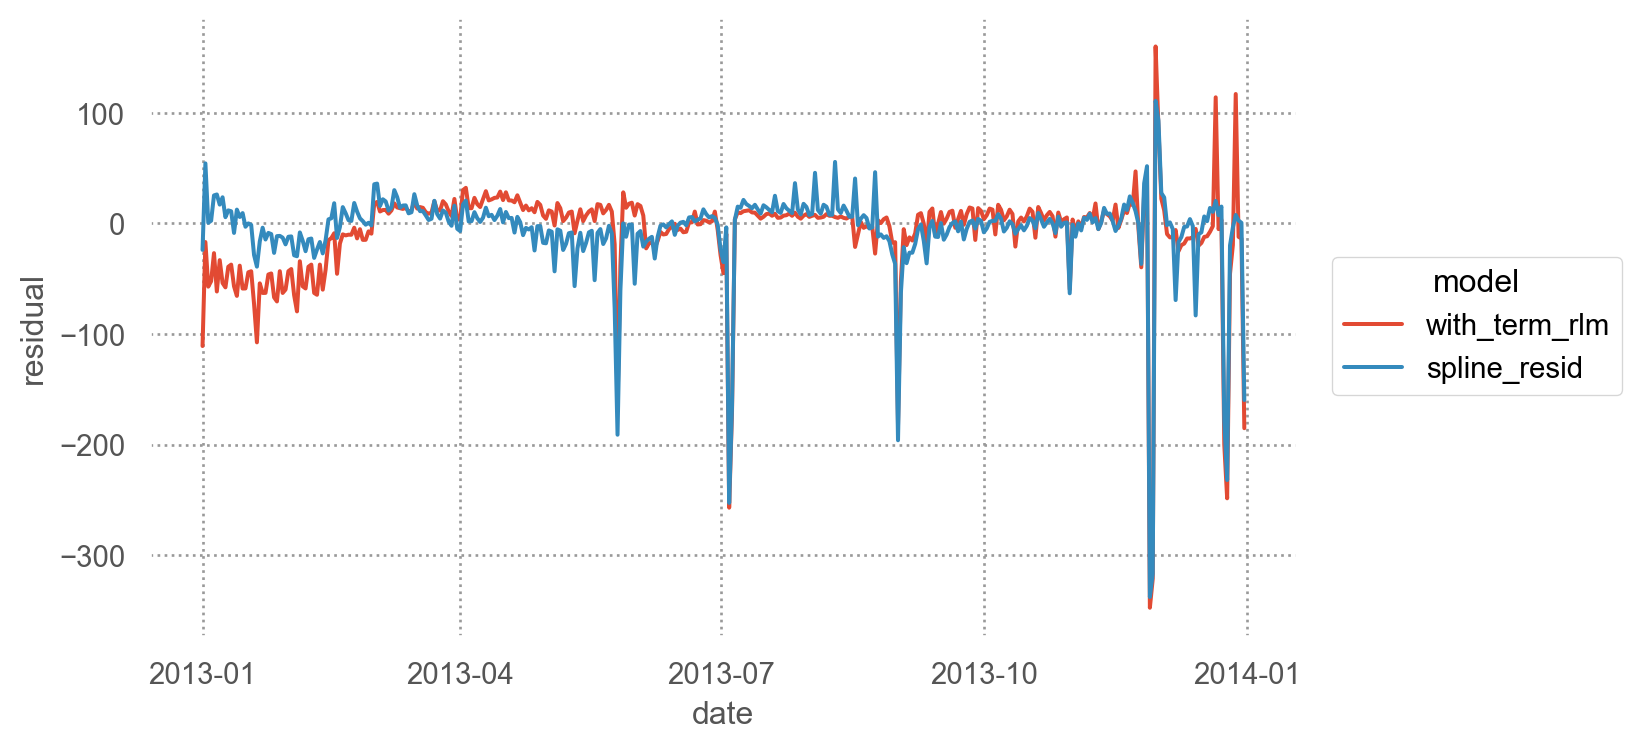
앞서 두 개의 명목변수의 예측한 선형모형, sm.RLM.from_formula("n ~ wday * term", data=daily) 과 그 잔차를 비교해 보았을 때 (아래 그림), 크게 다르지 않는 다는 점에서 우리의 모형이 만족스럽다고 볼 수 있음.
Regression vs. natural spline
= daily.melt(= ["date" ],= ["with_term_rlm" , "spline_resid" ],= "model" ,= "residual" ,
= 'date' , y= 'residual' , color= "model" )= (7 , 4 ))
참고: 좀 더 복잡한 모델; degree of freedom=10
= sm.RLM.from_formula("n ~ wday * cr(day, df=10)" , data= daily).fit()"spline_fit2" ] = mod_spline2.fittedvalues
Natural spline fit with df=10
= 'day' , y= 'spline_fit2' , color= "wday" )= '.5' ), y= "n" )"term" )= False )= (9 , 6 ))
Natural spline fit with df=5
= 'day' , y= 'spline_fit' , color= "wday" )= '.5' ), y= "n" )"term" )= False )= (7 , 5 ))
Q: 왜 앞서 지식에 기반해 패턴을 찾아 복잡한 과정을 거쳐 모형을 만들었나?
연습문제
Without interactions: what would you expect the model n ~ wday + cr(date, df=5)to look like? Knowing what you know about the data, why would you expect it to be not particularly effective?
What happens if you fit a day of week effect that varies by month (i.e. n ~ wday * month)? Why is this not very helpful?
n ~ wday * month를 이용해 모델을 세워보고, 이 모델이 어떤 문제를 가지고 있는지 살펴보세요.즉, 위의 예제에서는 term을 이용 (3개의 변수)하여 요일의 효과를 분리하였는데, month를 이용 (12개의 변수를 요구)하여 요일의 효과를 분리하는 것이 의미있을까?
Bike Sharing Demand
Forecast use of a city bikeshare system.Kaggle
자전거 대여 수에 영향을 주는 요인들을 살펴보고, 이를 예측하는 모델을 세워보세요.
hour.csv를 이용해 “시간대별” 대여수를 이용하거나day.csv를 이용해 앞서 다룬 것처럼 “날짜별” 대여수를 이용여러 모형을 세워보고 residuals을 분석
자전거의 수와 같은 “count”에 대한 값을 예측하는 경우 보통 count의 분포가 Poisson 분포를 보이는 경향이 있기에 이 분포를 고려한 generalized linear model을 이용하는 것이 더 적절할 수 있음.
간단히 count값을 \(\sqrt{N}\) 나 \(log(N+1)\) 로 변환하여 분포를 간단히 변형해서 분석할 수도 있음.
= pd.read_csv("../data/hour.csv" )3 )
   instant      dteday  season  yr  mnth  hr  holiday  weekday  workingday  \
0        1  2011-01-01       1   0     1   0        0        6           0
1        2  2011-01-01       1   0     1   1        0        6           0
2        3  2011-01-01       1   0     1   2        0        6           0

   weathersit  temp  atemp  hum  windspeed  casual  registered  cnt
0           1  0.24   0.29 0.81       0.00       3          13   16
1           1  0.22   0.27 0.80       0.00       8          32   40
2           1  0.22   0.27 0.80       0.00       5          27   32
= pd.read_csv("../data/day.csv" )3 )
   instant      dteday  season  yr  mnth  holiday  weekday  workingday  \
0        1  2011-01-01       1   0     1        0        6           0
1        2  2011-01-02       1   0     1        0        0           0
2        3  2011-01-03       1   0     1        0        1           1

   weathersit  temp  atemp  hum  windspeed  casual  registered   cnt
0           2  0.34   0.36 0.81       0.16     331         654   985
1           2  0.36   0.35 0.70       0.25     131         670   801
2           1  0.20   0.19 0.44       0.25     120        1229  1349
"dteday" : "date" , "cnt" : "count" }, axis= 1 , inplace= True )"date" ] = pd.to_datetime(bikeshare["date" ]) # datetime type으로 변환 "year" ] = bikeshare["date" ].dt.year # year 추출 "day" ] = bikeshare["date" ].dt.day_of_year # day of the year 추출 "season" ] = ("season" ]map ({1 : "winter" , 2 : "spring" , 3 : "summer" , 4 : "fall" }) # season을 문자열로 변환 "category" ) # category type으로 변환 "winter" , "spring" , "summer" , "fall" ], ordered= True ) # 순서를 지정 3 )
   instant       date  season  yr  mnth  holiday  weekday  workingday  \
0        1 2011-01-01  winter   0     1        0        6           0
1        2 2011-01-02  winter   0     1        0        0           0
2        3 2011-01-03  winter   0     1        0        1           1

   weathersit  temp  atemp  hum  windspeed  casual  registered  count  year  \
0           2  0.34   0.36 0.81       0.16     331         654    985  2011
1           2  0.36   0.35 0.70       0.25     131         670    801  2011
2           1  0.20   0.19 0.44       0.25     120        1229   1349  2011

   day
0    1
1    2
2    3


